





Node.js CLI and library for automated web performance data collection. Gather raw performance signals from local Lighthouse audits, PageSpeed Insights (PSI), and the CrUX API. Features built-in utilities to extract URLs from sitemaps and rendered pages, streamlining the data acquisition process for further analysis.
- Node.js >= 22.19
- Google Chrome installed locally (required for
labandlinks) - Google Cloud API key with PageSpeed Insights API and/or CrUX API enabled (required for
psi,crux,crux-history) — pass inline with--api-key, via a file with--api-key-path, or setWEB_PERF_PSI_API_KEY(key) orWEB_PERF_PSI_API_KEY_PATH(file path) environment variable
# Local Lighthouse audit
web-perf lab https://example.com

# PageSpeed Insights (real-user data)
web-perf psi --api-key=<YOUR_KEY> https://example.com

# CrUX data (28-day rolling average)
web-perf crux --api-key=<YOUR_KEY> https://example.com

# Historical CrUX trends (~6 months)
web-perf crux-history --api-key=<YOUR_KEY> https://example.comCreate an API key in the Google Cloud Console under APIs & Services > Credentials, with the following APIs enabled:
- PageSpeed Insights API — required for
psi - Chrome UX Report API — required for
cruxandcrux-history
Note: After enabling the Chrome UX Report API, it may take a few minutes for the API key to become effective.
# Inline
web-perf psi --api-key=<YOUR_KEY> <url>
web-perf crux --api-key=<YOUR_KEY> <url>

# From file (plain text, key only)
web-perf psi --api-key-path=<path-to-file> <url>

# Via environment variable (inline key)
export WEB_PERF_PSI_API_KEY=<YOUR_KEY>
web-perf psi <url>

# Via environment variable (file path)
export WEB_PERF_PSI_API_KEY_PATH=<path-to-key-file>
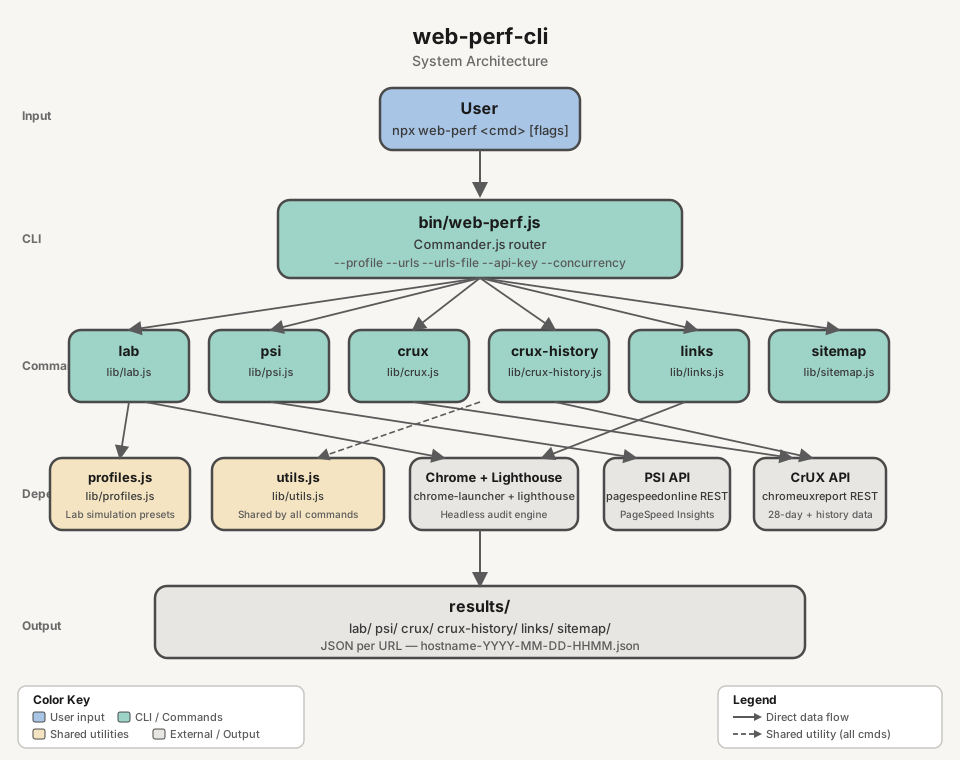
web-perf crux <url>web-perf <command> [options] <url>Available commands: lab, psi, crux, crux-history, links, sitemap, clean, list-profiles, list-networks, list-devices.
| Command | Source | Result | Options |
|---|---|---|---|
lab |
Local Lighthouse audit (headless Chrome) | JSON report with performance scores and Web Vitals | --profile, --network, --device, --category, --clean, --urls, --urls-file, --runs, --reuse-browser, --skip-audits, --blocked-url-patterns, --no-strip-json-props |
psi |
PageSpeed Insights API (real-user data + Lighthouse) | JSON with field metrics and lab scores | --api-key, --api-key-path, --urls, --urls-file, --strategy, --category, --clean, --concurrency, --delay |
crux |
CrUX API (origin or page, 28-day rolling average) | JSON with p75 Web Vitals and metric distributions | --scope, --form-factor, --api-key, --api-key-path, --urls, --urls-file, --concurrency, --delay |
crux-history |
CrUX History API (~6 months of weekly data points) | JSON with historical Web Vitals over time | --scope, --form-factor, --api-key, --api-key-path, --urls, --urls-file, --concurrency, --delay |
sitemap |
Domain's sitemap.xml (recursive, auto-detects sitemap URLs) |
JSON list of all URLs found | --depth, --delay, --output-ai |
links |
Rendered DOM via headless Chrome (SPA-compatible) | JSON list of internal links | --output-ai |
clean |
Existing lab or psi JSON on disk |
AI-friendly .clean.json (>=70% smaller) |
— |
list-profiles |
— | Prints available simulation profiles | — |
list-networks |
— | Prints available network presets | — |
list-devices |
— | Prints available device presets | — |
Runs a full Lighthouse audit in headless Chrome and saves the JSON report. Supports simulation profiles to test under different device and network conditions.
# Default (Lighthouse defaults: Moto G Power on Slow 4G)
web-perf lab <url>

# Single profile
web-perf lab --profile=low <url>
web-perf lab --profile=high <url>

# Multiple profiles (comma-separated)
web-perf lab --profile=low,high <url>

# All profiles (low, medium, high, native)
web-perf lab --profile=all <url>

# Granular control
web-perf lab --network=3g --device=iphone-12 <url>

# Profile with partial override (low device + wifi network)
web-perf lab --profile=low --network=wifi <url>

# Skip specific audits
web-perf lab --skip-audits=full-page-screenshot,screenshot-thumbnails <url>

# Block URL patterns (prevent asset downloads during audit, e.g. analytics, ads)
web-perf lab --blocked-url-patterns='*.google-analytics.com,*.facebook.net' <url>
web-perf lab --profile=low --blocked-url-patterns='*.ads.example.com' <url>

# Strip unneeded properties (i18n, timing) from JSON output (default: enabled)
web-perf lab --profile=low <url>  # JSON excludes i18n, timing
web-perf lab --no-strip-json-props <url>  # JSON includes all properties (raw Lighthouse output)

# Multiple URLs (<url> argument is ignored when --urls or --urls-file is provided)
web-perf lab --urls=<url1>,<url2> --profile=low
web-perf lab --urls-file=<urls.txt> --profile=all

# Repeat runs — audits each (URL x profile) pair N times and writes a variance summary
web-perf lab --runs=5 --profile=medium <url>
web-perf lab --runs=3 --profile=low,high --urls-file=<urls.txt>

# Share one Chrome across all runs (faster, but results become order-dependent)
web-perf lab --urls-file=<urls.txt> --profile=low --reuse-browser| Parameter | Required | Description |
|---|---|---|
<url> |
Yes* | Full URL to audit (e.g. https://example.com). Ignored when --urls or --urls-file is provided |
--profile <preset> |
No | Simulation profile(s): low, medium, high, native, all (comma-separated) |
--network <preset> |
No | Network throttling: 3g-slow, 3g, 4g, 4g-fast, wifi, none |
--device <preset> |
No | Device emulation: moto-g-power, iphone-12, iphone-14, ipad, desktop, desktop-large |
--urls <urls> |
No | Comma-separated list of URLs to audit |
--urls-file <path> |
No | Path to a file with one URL per line |
--category <list> |
No | Comma-separated Lighthouse categories to run. Values: performance, accessibility, best-practices, seo, agentic-browsing. Default: all |
--skip-audits <audits> |
No | Comma-separated Lighthouse audits to skip. Default: full-page-screenshot,screenshot-thumbnails,final-screenshot,valid-source-maps |
--blocked-url-patterns <patterns> |
No | Comma-separated URL patterns to block during the audit (e.g. *.google-analytics.com,*.facebook.net). Uses Chrome DevTools Protocol to prevent matching assets from being downloaded |
--clean |
No | Write an AI-friendly .clean.json alongside the raw output |
--runs <n> |
No | Audits per URL per profile (default: 1). Above 1, each run is written with a -runNN suffix and a .summary.json records the median, spread and benchmarkIndex range. Cannot be combined with --reuse-browser |
--reuse-browser |
No | Share one Chrome across all runs instead of launching a fresh one per run. ~1s/run faster, but Lighthouse does not clear DNS caches or socket pools between runs, so later runs score better purely by position in the run order |
--no-strip-json-props |
No | Disable stripping of unneeded properties (i18n, timing) from JSON output. Omit or leave blank to strip (default). See ADR-001 for rationale |
Run list-profiles, list-networks, or list-devices to see all available presets:
Chrome must be installed on the machine.
| Profile | Device | Network | Description |
|---|---|---|---|
low |
Moto G Power | Regular 3G | Budget phone on 3G |
medium |
Moto G Power | Slow 4G | Lighthouse default |
high |
Desktop 1350x940 | WiFi | Desktop on broadband |
native |
No emulation | No throttling | Actual device (no emulation, no throttling) |
When --network or --device are used together with --profile, the granular flags override the corresponding part of the profile. For example, --profile=low --network=wifi keeps the Moto G Power device but switches the network to WiFi.
web-perf list-profiles
web-perf list-networks
web-perf list-devicesLighthouse's Lantern engine does not measure a throttled page load. It records an unthrottled trace and re-times it, and two parts of that model leak the host machine into the score:
- CPU — observed task durations are multiplied by the profile's
cpuSlowdownMultiplierwith no correction for how fast the machine was at the time. A busy host produces longer observed tasks, and therefore a worse score, for the same page. - Network — each origin's observed server latency is added on top of the simulated RTT. A cold DNS/TLS/socket pool inflates it; a warm one does not.
Lighthouse records a per-run CPU benchmark in environment.benchmarkIndex but does not act on
it. Two mitigations are built in.
Every run gets its own browser. Lighthouse clears storage between runs but not DNS caches,
TCP/TLS sessions or HTTP/2 connections, so a shared browser makes each run faster than the last
purely by position in the run order. --reuse-browser opts back into sharing (~1s/run faster)
and is rejected alongside --runs, where it would measure the warm-up curve rather than the page.
--runs=N samples instead of guessing. Each (URL x profile) pair is audited N times. Every
run is kept, and a .summary.json records the median, the spread and the benchmarkIndex range:
For an even N the lower median is chosen, so medianRun always names a run that actually
happened. Warnings fire when benchmarkIndex varies more than 1.5x across runs (host was
not idle) or falls below 1000 (host too slow to compare against reference hardware). Runs
that fail are excluded from the statistics and listed under errors.
Scores are never rescaled after the fact: the variance is reported, not corrected.
Output: results/lab/lab-<hostname>[-<slug>]-YYYY-MM-DD-HHMMSS-<profile>.json
With --runs=N, each run is written as ...-<profile>-runNN.json plus one
...-<profile>.summary.json per (URL x profile) pair, named after the group's first run.
Fetches real-user metrics and Lighthouse results from the PageSpeed Insights API.
# Single URL with inline API key
web-perf psi --api-key=<PSI_KEY> <url>
# Single URL with API key from file (plain text, key only)
web-perf psi --api-key-path=<path-to-key-file> <url>
# Multiple URLs (comma-separated) — <url> argument is ignored if present
web-perf psi --urls=<url1>,<url2>,<url3> --api-key=<PSI_KEY>
# Multiple URLs from file (one URL per line) — <url> argument is ignored if present
web-perf psi --urls-file=<urls.txt> --api-key=<PSI_KEY>
# Parallel processing (10 concurrent requests, 100ms delay between each)
web-perf psi --urls-file=<urls.txt> --api-key=<PSI_KEY> --concurrency=10 --delay=100
# Strategy selection — default runs both mobile + desktop (two API requests per URL)
web-perf psi --strategy=mobile --api-key=<PSI_KEY> <url>
web-perf psi --strategy=desktop --api-key=<PSI_KEY> <url>
web-perf psi --strategy=mobile,desktop --api-key=<PSI_KEY> <url>| Parameter | Required | Description |
|---|---|---|
<url> |
Yes* | Full URL to analyze (e.g. https://example.com) |
--api-key <key> |
No** | PageSpeed Insights API key passed inline |
--api-key-path <path> |
No** | Path to a plain text file containing only the API key |
--urls <list> |
No | Comma-separated list of URLs. When provided, <url> argument is ignored |
--urls-file <path> |
No | Path to a file with one URL per line. When provided, <url> argument is ignored |
--strategy <list> |
No | Comma-separated PSI strategies. Values: mobile, desktop. Default: mobile,desktop (both run per URL → two API requests and two output files per URL) |
--category <list> |
No | Comma-separated Lighthouse categories to include. Values: performance, accessibility, best-practices, seo. Default: all four |
--clean |
No | Write an AI-friendly .clean.json alongside the raw output |
--concurrency <n> |
No | Max parallel API requests when processing multiple URLs. Default: 5 |
--delay <ms> |
No | Delay in ms between requests per worker. Default: 0 (no delay) |
Built-in quota protection: PSI request starts are capped at 4 requests/second globally during batch runs, regardless of --concurrency. Total API calls = urls × strategies; the PSI free quota is 25,000 queries/day and 240/min — pin --strategy=mobile (or desktop) when you need to halve consumption.
* Not required when --urls or --urls-file is provided.
** A PSI API key is required. Provide it via --api-key, --api-key-path, or the WEB_PERF_PSI_API_KEY / WEB_PERF_PSI_API_KEY_PATH environment variables. CLI flags take precedence.
# Only performance
web-perf psi --category=performance --api-key-path=<key-file> <url>
# Performance and SEO only
web-perf psi --category=performance,seo --api-key-path=<key-file> <url>--api-keyflag (inline key)--api-key-pathflag (file path)WEB_PERF_PSI_API_KEYenv var (inline key)WEB_PERF_PSI_API_KEY_PATHenv var (file path)- Interactive prompt
Output: results/psi/psi-<hostname>[-<slug>]-YYYY-MM-DD-HHMMSS-<strategy>.json (one file per URL per strategy — default produces both -mobile.json and -desktop.json)
Queries Chrome UX Report data via the CrUX REST API. Returns a 28-day rolling average of Web Vitals metrics. Supports both origin-level and page-level queries via --scope. Pages need ~300+ monthly visits to have data.
# Origin-level (default)
web-perf crux --api-key=<KEY> <url>
# Page-level
web-perf crux --scope=page --api-key=<KEY> <url>
# Multiple URLs (page scope)
web-perf crux --urls=<url1>,<url2> --api-key=<KEY>
web-perf crux --urls-file=<urls.txt> --api-key=<KEY> --concurrency=10 --delay=100| Parameter | Required | Description |
|---|---|---|
<url> |
Yes* | URL or origin to query |
--scope <scope> |
No | Query scope: origin or page. Default is origin for single URL input, and page when using --urls or --urls-file |
--form-factor <list> |
No | Comma-separated form factors to query. Values: phone, desktop, tablet. Default: phone,desktop (two API requests and two output files per URL) |
--api-key <key> |
No** | CrUX API key |
--api-key-path <path> |
No** | Path to plain text file containing the API key |
--urls <urls> |
No | Comma-separated URLs (page scope) |
--urls-file <path> |
No | Path to file with one URL per line (page scope) |
--concurrency <n> |
No | Max parallel requests. Default: 5 |
--delay <ms> |
No | Delay between requests in ms. Default: 0 |
Built-in quota protection: CrUX request starts are capped at 2.5 requests/second globally during batch runs, regardless of --concurrency.
* Not required when --urls or --urls-file is provided.
** A CrUX API key is required. Provide via --api-key, --api-key-path, or the WEB_PERF_PSI_API_KEY / WEB_PERF_PSI_API_KEY_PATH environment variables.
Output: results/crux/crux-<hostname>[-<slug>]-YYYY-MM-DD-HHMMSS-<form-factor>.json (one file per form factor — default produces both -phone.json and -desktop.json)
Queries the CrUX History API for ~6 months of weekly data points. Each data point represents a 28-day rolling average. Supports both origin-level and page-level queries.
# Origin-level (default)
web-perf crux-history --api-key=<KEY> <url>
# Page-level
web-perf crux-history --scope=page --api-key=<KEY> <url>
# Multiple URLs (page scope)
web-perf crux-history --urls=<url1>,<url2> --api-key=<KEY>
web-perf crux-history --urls-file=<urls.txt> --api-key=<KEY> --concurrency=10 --delay=100| Parameter | Required | Description |
|---|---|---|
<url> |
Yes* | URL or origin to query (e.g. https://example.com) |
--scope <scope> |
No | Query scope: origin or page. Default is origin for single URL input, and page when using --urls or --urls-file |
--form-factor <list> |
No | Comma-separated form factors to query. Values: phone, desktop, tablet. Default: phone,desktop (two API requests and two output files per URL) |
--api-key <key> |
No** | CrUX API key |
--api-key-path <path> |
No** | Path to plain text file containing the API key |
--urls <urls> |
No | Comma-separated URLs (page scope) |
--urls-file <path> |
No | Path to file with one URL per line (page scope) |
--concurrency <n> |
No | Max parallel requests. Default: 5 |
--delay <ms> |
No | Delay between requests in ms. Default: 0 |
Built-in quota protection: CrUX History request starts are capped at 2.5 requests/second globally during batch runs, regardless of --concurrency.
* Not required when --urls or --urls-file is provided.
** A CrUX API key is required. Credential resolution is identical to crux (see above).
Output: results/crux-history/crux-history-<hostname>[-<slug>]-YYYY-MM-DD-HHMMSS-<form-factor>.json (one file per form factor — default produces both -phone.json and -desktop.json)
Parses a domain's sitemap.xml (including sitemap indexes) and extracts all URLs. Auto-detects if the URL points to a sitemap (.xml extension) or uses <url>/sitemap.xml by default.
web-perf sitemap <url>
web-perf sitemap --depth=3 <url>
web-perf sitemap https://example.com/custom-sitemap.xml
web-perf sitemap --output-ai <url>| Parameter | Required | Description |
|---|---|---|
<url> |
Yes | Domain or sitemap URL (e.g. example.com or example.com/sitemap-pages.xml) |
--depth <n> |
No | Max recursion depth for sitemap indexes. Default: 3 |
--delay <ms> |
No | Delay between requests in ms (randomized ±50ms). Default: 0 |
--output-ai |
No | Generate AI-friendly .txt output (one URL per line, normalized) |
Child sitemaps must be on the same origin. When an index lists a child sitemap, it is
followed only if its scheme, host and port all match the URL the crawl started from.
Anything else is skipped with a warning — including a www. variant of the same domain,
which is a different origin. The sitemaps protocol already scopes a sitemap to its own host
and requires verification for cross-host submission, so this also stops an untrusted sitemap
from pointing the crawler at an unrelated address.
URLs are XML-entity decoded. The sitemaps protocol requires & to be escaped inside
<loc>, so a location written as https://example.com/p?a=1&b=2 is extracted as
https://example.com/p?a=1&b=2 — the URL the site actually meant. Without this, every
sitemap URL carrying a query string would be unusable when piped into --urls-file.
Output: results/sitemap/sitemap-<hostname>-YYYY-MM-DD-HHMMSS.json
Extracts internal links from the rendered DOM using headless Chrome. SPA-compatible (waits for JavaScript rendering).
web-perf links <url>
web-perf links --output-ai <url>| Parameter | Required | Description |
|---|---|---|
<url> |
Yes | URL to extract links from |
--output-ai |
No | Generate AI-friendly .txt output (one URL per line, normalized) |
Output: results/links/links-<hostname>[-<slug>]-YYYY-MM-DD-HHMMSS.json
Strips a Lighthouse or PSI JSON report down to the information an AI needs: failing audits with details, category scores, and CrUX data. Clean files are ≥70% smaller than the raw output, making them practical for pasting into AI prompts.
# Generate clean file alongside raw output at run time
web-perf lab --clean https://example.com
web-perf psi --clean --api-key=<YOUR_KEY> https://example.com
# Post-process existing raw files
web-perf clean results/lab/lab-example.com-2026-09-02-094255-medium.json
web-perf clean results/lab/
web-perf clean 'results/**/*.json'Clean files are written to a clean/ subfolder next to the raw output:
results/lab/clean/lab-<hostname>[-<slug>]-YYYY-MM-DD-HHMMSS-<profile>.clean.jsonresults/psi/clean/psi-<hostname>[-<slug>]-YYYY-MM-DD-HHMMSS-<strategy>.clean.json
The clean file is self-describing: JSON.parse(cleanFile)._clean === true.
Output filenames carry a slug of the URL's path, so auditing several pages of one host produces files you can tell apart without opening them:
https://a.com/ -> psi-a.com-2026-09-02-171221-mobile.json
https://a.com/es/page-one -> psi-a.com-es-page-one-2026-09-02-171221-mobile.json
https://a.com/es/productos/zapatos -> lab-a.com-es-productos-zapatos-2026-09-02-171221-low.json
https://a.com/es/page?utm_source=x -> psi-a.com-es-page-2026-09-02-171221-mobile.json
https://a.com/es/zapatos-de-niño -> psi-a.com-es-zapatos-de-niño-2026-09-02-171221-mobile.json
The query string and fragment are dropped, so tracking parameters do not produce a different
filename for the same page. Percent-encoding is decoded and Unicode letters are kept, so
non-Latin paths stay readable (/日本語/ページ → 日本語-ページ) instead of becoming the hex of
their UTF-8 bytes.
A root path adds no slug segment, so single-page runs and origin-scoped crux /
crux-history keep exactly the filenames they produced before. sitemap is passed an origin and
is likewise unchanged.
Slugs are capped at 80 bytes. Past that the path's tail is kept — the discriminating end of a
hierarchical URL — and a 6-character hash of the full path is appended. Two URLs that still
collide fall back to a _NN counter, and each file's url field remains authoritative either
way. urlSlug is exported from web-perf-cli/utils if you need to predict a filename.
| Variable | Command | Description |
|---|---|---|
WEB_PERF_PSI_API_KEY |
psi, crux, crux-history |
API key for PageSpeed Insights / CrUX API |
WEB_PERF_PSI_API_KEY_PATH |
psi, crux, crux-history |
Path to file containing the API key |
CLI flags (--api-key, --api-key-path) always take precedence over environment variables.
All results are saved as JSON files under the results/ directory, organized by command:
results/
├── lab/
│ ├── lab-example.com-2026-09-02-094255-medium.json
│ ├── lab-example.com-2026-09-02-094255-medium-run01.json (with --runs=N)
│ ├── lab-example.com-2026-09-02-094255-medium.summary.json (with --runs=N)
│ └── clean/
│ └── lab-example.com-2026-09-02-094255-medium.clean.json (with --clean)
├── psi/
│ ├── psi-example.com-2026-09-02-094255-mobile.json (one per strategy)
│ ├── psi-example.com-2026-09-02-094255-desktop.json
│ └── clean/
│ └── psi-example.com-2026-09-02-094255-mobile.clean.json (with --clean)
├── crux/
│ ├── crux-www.example.com-2026-09-02-094255-phone.json (one per form factor)
│ └── crux-www.example.com-2026-09-02-094255-desktop.json
├── crux-history/
│ └── crux-history-www.example.com-2026-09-02-094255-phone.json
├── links/
│ └── links-www.example.com-2026-09-02-094255.json
└── sitemap/
└── sitemap-www.example.com-2026-09-02-094255.json
web-perf can be used as a Node.js library. The pure audit functions return data directly — no files written, no disk I/O — making them safe for use in servers and backends.
// CommonJS
const { runCruxAudit, runPsiAudit, runLabAudit } = require('@hugoer/web-perf-cli');
// Subpath imports (load only what you need)
const { runCruxAudit, runCruxAuditBatch } = require('@hugoer/web-perf-cli/crux');
const { runPsiAudit, runPsiAuditBatch } = require('@hugoer/web-perf-cli/psi');
const { runLabAudit, runLabPlan } = require('@hugoer/web-perf-cli/lab');
const { buildRunSummary } = require('@hugoer/web-perf-cli/variance');| Function | Module | Returns |
|---|---|---|
runLabAudit(url, { port?, profile?, network?, device?, categories?, skipAudits?, blockedUrlPatterns?, stripJsonProps?, silent? }?) |
web-perf-cli/lab |
Promise<LabReport> |
runPsiAudit(url, apiKey, categories?, strategy?) |
web-perf-cli/psi |
Promise<PsiReport> |
runPsiAuditBatch(urls, apiKey, categories, options?) |
web-perf-cli/psi |
Promise<PsiBatchResult[]> |
runCruxAudit(url, apiKey, options?) |
web-perf-cli/crux |
Promise<CruxReport> |
runCruxAuditBatch(urls, apiKey, options?) |
web-perf-cli/crux |
Promise<CruxBatchResult[]> |
runCruxHistoryAudit(url, apiKey, options?) |
web-perf-cli/crux-history |
Promise<CruxHistoryReport> |
runCruxHistoryAuditBatch(urls, apiKey, options?) |
web-perf-cli/crux-history |
Promise<CruxHistoryBatchResult[]> |
selectMedianRun(scores) |
web-perf-cli/variance |
number (index; lower median, -1 if empty) |
assessStability(benchmarkIndexes) |
web-perf-cli/variance |
{ stable: boolean, warnings: string[] } |
buildRunSummary(runs, context?) |
web-perf-cli/variance |
RunSummary |
urlSlug(url) |
web-perf-cli/utils |
string (path slug used in output filenames; '' for a root path) |
The variance helpers are pure too — they take report-shaped plain objects and do no I/O,
so they can summarise runs collected by any means, not just this CLI's.
// Single URL
const report = await runCruxAudit('https://example.com', apiKey, { scope: 'origin' });
console.log(report.metrics);
// Batch with progress
const results = await runCruxAuditBatch(urls, apiKey, {
scope: 'page',
concurrency: 5,
onProgress: (done, total, url) => console.log(`${done}/${total}: ${url}`),
});The CLI wrapper functions (runLab, runPsi, runCrux, runCruxHistory, …) are also exported and behave identically to the CLI commands — they write JSON to disk and return the output file path.
runLabPlan(urls, runs, options?, hooks?) (from web-perf-cli/lab) is the orchestrator behind
web-perf lab: it walks every (URL x profile x repeat) combination, owns the browser lifecycle,
writes each report plus any .summary.json, and reports progress through onRunStart /
onRunComplete / onRunError / onSummary callbacks rather than logging. It returns
Promise<LabPlanResult[]>.
examples/ holds 21 scripts covering every library entry point. They depend on the
package as file:.., so they always run against the working tree rather than a published version:
npm install --prefix examples # once
node examples/lab-audit.js # then, from the repo rootTwo conventions run through the directory. A script ending in -audit prints to the console and
writes nothing; one ending in -save writes JSON under results/ and prints the paths. The
lab-* scripts need Chrome installed locally; the psi-*, crux-* and crux-history-* scripts
need WEB_PERF_PSI_API_KEY set (see API key).
| Script | What it demonstrates |
|---|---|
lab-audit.js |
One audit through headless Chrome, printed to the console |
lab-save.js |
The same audit written to results/lab/ |
lab-audit-profiles.js |
The low / medium / high presets run back to back and compared |
lab-save-profiles.js |
One file per profile, with the profile name in the filename |
lab-audit-custom-throttling.js |
Explicit network + device instead of a preset, plus blockedUrlPatterns |
lab-audit-variance.js |
Why repeated runs disagree, and using the pure variance helpers to pick a median |
lab-save-runs.js |
runLabPlan driving a full (URL x profile x repeat) matrix through its callbacks |
| Script | What it demonstrates |
|---|---|
psi-audit.js |
One URL; category scores and Core Web Vitals to the console |
psi-save.js |
The full API response written to results/psi/ |
psi-audit-categories.js |
Requesting only PERFORMANCE and SEO, which is faster than all four |
psi-batch-audit.js |
Many URLs concurrently, rate-limited to the PSI quota |
psi-batch-save.js |
The same batch, one file per URL, with a progress line each |
| Script | What it demonstrates |
|---|---|
crux-audit.js |
Page-level metric distributions for one URL |
crux-audit-origin.js |
scope: 'origin' — every page aggregated, for a high-level check |
crux-save.js |
One file per form factor (phone + desktop by default, so two) |
crux-batch-audit.js |
Many URLs concurrently, printed as a summary table |
crux-batch-save.js |
The same batch written to results/crux/ |
| Script | What it demonstrates |
|---|---|
crux-history-audit.js |
The LCP trend for one URL, period by period |
crux-history-save.js |
One file per form factor under results/crux-history/ |
crux-history-batch-audit.js |
Oldest vs latest LCP p75 per URL — improved or regressed |
crux-history-batch-save.js |
The same batch written to disk |
TypeScript type declarations are included and resolve automatically when you install the package. No @types/ package needed.
import { runCruxAudit, runPsiAudit } from '@hugoer/web-perf-cli';
import type { CruxReport, PsiReport, LabReport } from '@hugoer/web-perf-cli';
// Subpath imports also carry types
import { runCruxHistoryAudit } from '@hugoer/web-perf-cli/crux-history';
import type { CruxHistoryReport } from '@hugoer/web-perf-cli/crux-history';Key exported types:
| Type | Description |
|---|---|
LabReport |
Lighthouse JSON with i18n and timing stripped (categories, audits, environment, configSettings). Pass --no-strip-json-props / stripJsonProps: false to keep them |
PsiReport |
PageSpeed Insights API response (loadingExperience, lighthouseResult) |
CruxReport |
CrUX 28-day snapshot (metrics, collectionPeriod, scope, key) |
CruxHistoryReport |
CrUX historical snapshot (metrics, collectionPeriods array) |
CruxMetric |
Single CrUX metric (histogram bins, p75 percentile) |
PsiBatchResult |
{ url, data: PsiReport | null, error: string | null } |
CruxBatchResult |
{ url, data: CruxReport | null, error: string | null } |
CruxHistoryBatchResult |
{ url, data: CruxHistoryReport | null, error: string | null } |
LabPlanResult |
{ url, profile, outputPath?, error? } — one per run in a runLabPlan plan |
LabAuditOptions |
Options for a single runLabAudit call (port, profile, network, device, categories, skipAudits, blockedUrlPatterns, stripJsonProps, silent) |
LabWriteOptions |
LabAuditOptions plus clean — what runLabToDisk takes |
LabPlanControls |
Plan-level controls only: continueOnError, reuseBrowser, repeats |
LabPlanOptions |
LabPlanControls plus the per-run options, minus runNumber and port, which runLabPlan owns |
LabProfile |
One PROFILES entry: { network, device, label }, both keys null for the native profile |
NetworkPreset |
One NETWORK_PRESETS entry: nominal rttMs, throughputKbps, uploadKbps, cpuSlowdownMultiplier, label |
DevicePreset |
One DEVICE_PRESETS entry: width, height, deviceScaleFactor, mobile, formFactor, label |
RunSummary |
Variance record for one repeated (URL x profile) pair: median, spread, benchmarkIndex range, per-metric arrays, stability warnings |
Every exported constant is frozen and published as readonly: the arrays CHROME_FLAGS,
DEFAULT_SKIP_AUDITS, LAB_CATEGORIES, PSI_STRATEGIES, DEFAULT_PSI_STRATEGIES,
CRUX_FORM_FACTORS and DEFAULT_CRUX_FORM_FACTORS, plus the three preset objects
PROFILES, NETWORK_PRESETS and DEVICE_PRESETS (from web-perf-cli/profiles). Mutating
any of them fails to compile, and at runtime throws under strict mode (ESM, or 'use strict')
rather than taking effect.
The three objects are frozen at every level, because the damaging write is one step down:
resolveProfileSettings reads the presets on every audit, so PROFILES.low.network = 'wifi'
would silently change what later runs measure while the report still named the original
profile. Build a variant by spreading instead:
const custom = { ...NETWORK_PRESETS['3g'], rttMs: 250 };
const onWifi = { ...PROFILES.low, network: 'wifi' };# Clone and install dependencies
git clone https://github.com/Hugoer/web-perf-cli.git
cd web-perf-cli
npm install
# Run the CLI locally
node bin/web-perf.js lab https://example.com| Script | Description |
|---|---|
npm run lint |
Lint and auto-fix with ESLint |
npm test |
Run all tests (vitest) |
npm run generate-types |
Regenerate types/lib/*.d.ts from JSDoc annotations |
npm run check-types |
Type-check a sample consumer against the generated declarations |
Run them in that order at the end of every change — lint must pass before test,
generate-types after that so the regenerated .d.ts reflects the final JSDoc, and
check-types last, since it compiles a sample consumer against what generate-types emitted.
Type declarations in types/lib/ are generated from JSDoc @typedef annotations in lib/. Run npm run generate-types after changing any return shape in a run*Audit function, then commit the updated types/ alongside the code change.
npm run generate-types
git add types/ lib/
git commit -m "feat: update CruxReport shape"MIT
{
  "url": "https://example.com/",
  "profile": "medium",
  "runs": 5,
  "medianRun": 5,
  "medianOutputPath": "results/lab/lab-example.com-...-medium-run05.json",
  "scores": [0.56, 0.71, 0.68, 0.70, 0.69],
  "median": 0.69,
  "spread": { "min": 0.56, "max": 0.71 },
  "benchmarkIndex": { "min": 1799, "max": 3010, "values": [1799, 2950, 2880, 3010, 2940] },
  "metrics": { "total-blocking-time": [275, 92, 96, 88, 90] },
  "stability": {
    "stable": false,
    "warnings": ["benchmarkIndex varied 1.67x across runs (1799-3010) - host was not idle"]
  }
}