Repository navigation
Add V8 Inspector/CDP support for Chrome DevTools debugging #7
Description
Activity
Full source editor/debugger client and validation addendum
This addendum makes the latest requirement a governing constraint for every implementation detail in this issue:
We want to implement full source code editor and debugging features in code editor in inspector it already has some foundation fro Avalonia edit extension we did but we need full vs code debug experience, do it along working on current goals
The WebScene runtime work is therefore not complete when Chrome can merely attach. Every protocol, lifecycle, source-identity, source-map, pause-loop, and transport decision must also provide enough faithful V8 information for the CDP Inspector application's source editor to deliver a VS Code-class debug workflow. The current client-side implementation is tracked by CDP PR #109.
1. WebScene-to-editor debugging contract
For the full source editor/debugger requirement, WebScene must expose the real V8
Runtime,Debugger,Profiler, andHeapProfilerprotocol without translating or synthesizing debugger state. The Inspector editor must receive stable script IDs and URLs, exact zero-based line/column positions, source-map URLs, execution-context lifecycle events, breakpoint resolution events, pause reasons/data, call-frame IDs, scope chains, remote-object IDs, async stack traces, exception details, and console stack traces.The contract must support at least:
- enumerating runtime scripts and opening generated sources;
- retrieving source with
Debugger.getScriptSource; - searching loaded source with
Debugger.searchInContent; - URL-, regex-, script-, and exact-location breakpoints;
- breakpoint resolve/remove/enable/disable and persistence across navigation/reload;
- pause, continue, step over, step into, step out, and restart frame;
- pause on none/uncaught/all exceptions;
- call stack, async call stack, scopes, locals, watches, and expression evaluation;
Runtime.getProperties, object groups, object release, previews, getters, and exception-safe formatting;Debugger.evaluateOnCallFramewith side-effect/error reporting;- live edit through
Debugger.setScriptSource, including compile errors, changed call frames, restart requirements, and source refresh; - blackboxing/skip-list behavior needed by a VS Code-style editor;
- CPU and heap profiling while using the same target/session transport.
Every unsupported V8 command must return the original Inspector error response and must not destabilize the session.
2. Original React/TypeScript source experience
For the full source editor/debugger requirement, generated bundle debugging alone is insufficient. Development builds must emit valid source maps with
sourcesContent; WebScene must preserve canonicalScriptOrigin,sourceURL, andsourceMappingURLdata; and the transport must leaveDebugger.scriptParsedfields unchanged.Acceptance must cover:
- opening original
.jsx,.tsx,.js, and.tssources in the Inspector editor; - setting a breakpoint in original React event-handler code before the bundle executes;
- binding that breakpoint to the correct generated location;
- showing the original source and mapped paused line when the breakpoint hits;
- mapping call-frame locations and stack navigation back to original sources;
- preserving multiple source roots, relative paths, URL-encoded paths, inline maps, external maps, and embedded source content;
- displaying a clear generated-source fallback when a source map is missing or invalid;
- documenting that V8 exposes JavaScript execution state, while React component/hook inspection requires a separate React DevTools bridge.
3. Inspector editor interaction requirements
For the full source editor/debugger requirement, the CDP Inspector app must consume the WebScene target exactly as it consumes Node or Chrome V8 targets. Its source workspace must provide a real code-editor experience rather than a read-only protocol viewer:
- editable documents, syntax highlighting, line numbers, minimap, selection, find, source search, dirty state, save/apply-live-edit, and compile-error feedback;
- breakpoint gutter, enabled/disabled/unbound/resolved states, conditional and logpoint metadata when supported, and an active-statement marker;
- debugger toolbar and keyboard commands for continue/pause, stepping, restart frame, breakpoint toggle, and live-edit save;
- call-stack navigation, scope/property expansion, watch add/remove/refresh, hover/selection evaluation, and a debug console;
- exception breakpoint controls, blackboxing controls, source-map status, connection/target status, and graceful capability gating;
- correct behavior during navigation, target replacement, reconnect, debugger disconnect, engine shutdown, and editor-layout restoration.
WebScene implementation choices must be validated against these consumers and may not rely on Chrome DevTools-only behavior that prevents another conforming CDP client from debugging the same isolate.
4. Required development validation matrix
For the full source editor/debugger requirement, development must continuously exercise both protocol correctness and visible editor behavior:
- Native/in-memory V8 Inspector session — enable Runtime/Debugger, enumerate scripts, evaluate, set and hit a breakpoint, inspect scopes, step, resume, live-edit, profile, disconnect, and dispose while paused.
- Headless remote Node session — connect the CDP Inspector app to a real
node --inspecttarget and run deterministic integration flows for source loading, breakpoints, watches, call stacks, restart frame, evaluation, source search, and live edit. - Headless WebScene session — run the real WebScene V8 target with source maps, trigger native input, pause in original React source, evaluate/step/resume, and verify the UI completes its work.
- Real Chrome browser CDP session — launch Chrome with a dedicated remote-debugging profile and verify target discovery, Runtime/Debugger capabilities, scripts, evaluation, pause/step/resume, and clean detach.
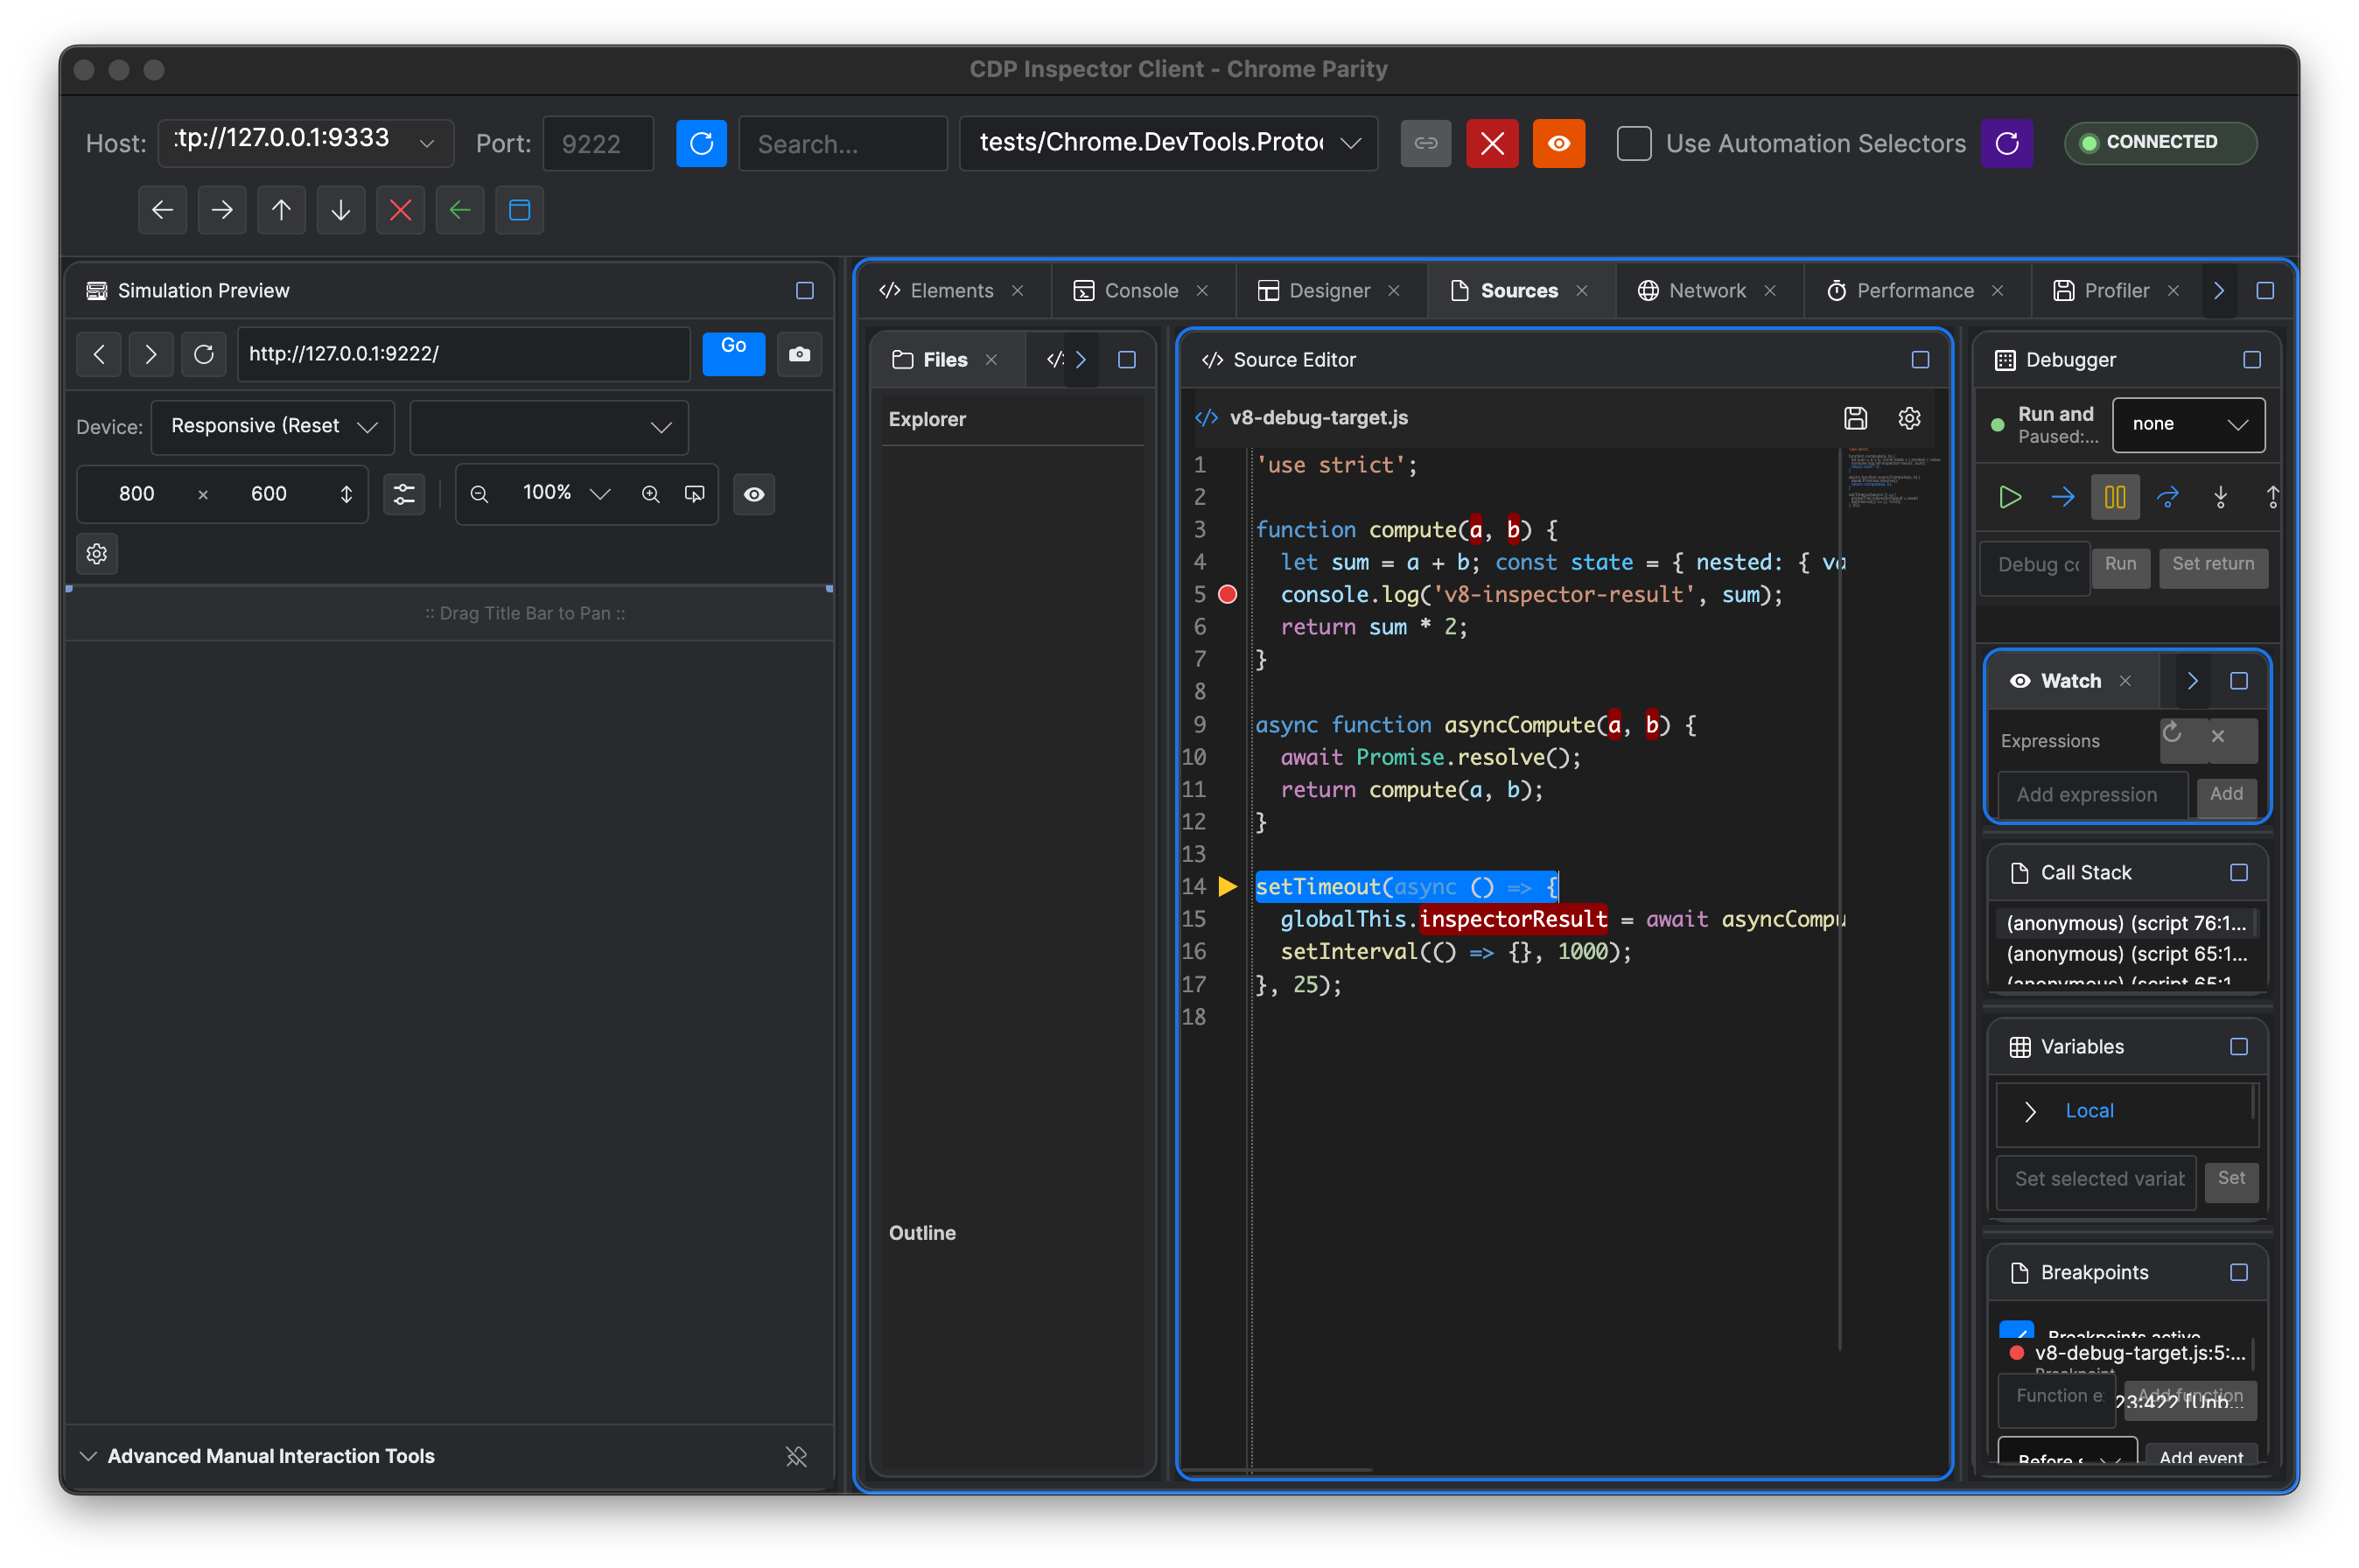
- Real CDP Inspector desktop app through Computer control — operate the packaged Release app as a user would, connect to Node, Chrome, and WebScene targets, interact with the source editor/debugger UI, and capture screenshots of connected, paused, mapped-source, watch/scope, and live-edit states.
- Remote CDP controlling the Inspector itself — expose the Inspector Avalonia app's own CDP endpoint while it is debugging a V8 application, then use an independent CDP client to inspect/control the Inspector UI. This validates the two simultaneous sessions and detects reentrancy, dispatcher, socket-ownership, and target-selection defects.
- Release/NativeAOT validation — run the sample and packaged Inspector in Release mode, including DOM discovery, box model, input dispatch, recording/replay, and all V8 debugger flows; Debug-only success is not sufficient.
Each end-to-end run must save a machine-readable report and screenshots. Failures must retain enough protocol trace and target metadata to distinguish runtime, transport, mapping, and client/editor defects without logging sensitive expression values by default.
5. Additional headless integration tests
For the full source editor/debugger requirement, add repeatable tests covering:
- target discovery against Node, Chrome, and WebScene
/json/listvariants; - enable ordering before
Runtime.runIfWaitingForDebugger; - notifications arriving before, between, and after command responses;
- multiple outstanding requests, monotonically increasing IDs, reconnect, cancellation, isolated event subscribers, and exact socket/reader ownership;
- script parsing before/after the editor panel is opened;
- breakpoints set before a matching script loads;
- pause at original-source and generated-source locations;
- nested objects, getters throwing exceptions, unavailable/optimized-out values, cyclic graphs, and object release;
- watch evaluation across steps and frame changes;
- live-edit success, compile error, stack changed, and edit while running/paused;
- navigation and context destruction without stale sources, remote objects, or breakpoint bindings;
- debugger disconnect and application shutdown while running and while paused;
- source-map edge cases and missing-source fallback;
- simultaneous remote control of the Inspector app while its V8 debug session is paused;
- Release/NativeAOT JSON payload serialization for DOM attributes, box-model quads, selectors, and debugger metadata.
6. Screenshot evidence required for acceptance
For the full source editor/debugger requirement, attach or link screenshots showing:
- WebScene target discovery;
- original React/TypeScript source open in the Inspector editor;
- bound breakpoint in original source;
- paused active line with breakpoint gutter and debugger toolbar;
- populated call stack, scopes/locals, and watches;
- debug-console evaluation on the selected frame;
- live-edit applied and compile-error presentation;
- real Chrome target session;
- real Node target session;
- the Inspector app being remotely inspected/controlled while it is debugging another V8 target.
Screenshots are validation artifacts, not substitutes for automated assertions; both are required.
7. Expanded definition of done
For the full source editor/debugger requirement, all existing acceptance criteria remain in force and the issue is additionally complete only when:
- The WebScene V8 target works unchanged with Chrome DevTools and the CDP Inspector editor.
- The Inspector editor provides the source, breakpoint, stepping, call-stack, scope, watch, evaluation, exception, live-edit, source-map, and profiling workflows listed above.
- A breakpoint set in original React/TypeScript source binds and pauses at the correct mapped location.
- Headless Node, Chrome, and WebScene sessions run deterministically in CI where platform support permits.
- A packaged Release Inspector app is exercised through desktop Computer control.
- The Inspector app can itself be inspected over remote CDP while its separate V8 debugging session remains usable.
- Release/NativeAOT tests cover protocol payload construction and UI record/replay flows.
- Machine-readable reports and screenshot evidence are retained for the acceptance run.
- Unsupported browser domains fail cleanly without degrading the source-debugging session.
- Security, pause-loop responsiveness, disconnect, navigation, multi-session policy, backpressure, and shutdown requirements are verified.
This addendum intentionally keeps WebScene's isolate/Inspector responsibilities separate from the CDP Inspector app's editor responsibilities, while treating the complete VS Code-style workflow as the cross-repository acceptance target.
Implementation status update from CDP PR #109: the Inspector now has persistent rich breakpoints (standard, conditional, and logpoints), breakpoint activation and reconnect rebinding, async stack display, ignore-list/blackboxing controls, editable paused-frame variables, hover and selection evaluation, live edit, watches, and hardened standalone V8 transport behavior. We validated the full remote chain by controlling the packaged Inspector through its own CDP endpoint while it debugged a real paused Node V8 process (33/33 steps), plus real Chrome/Node protocol tests, headless UI tests, Playwright, and Computer Use screenshots. WebScene still needs to expose the standard V8 Inspector discovery/WebSocket endpoint and preserve script URLs/source-map metadata as detailed above; once it does, the same UI and protocol paths apply without a WebScene-specific debugger dialect.
Status update after the latest WebScene and CDP pushes:
- WebScene PR Add end-to-end WebScene V8 Inspector debugging #8 now exposes a real attachable V8 Inspector target through Avalonia and Uno, including inspect-brk startup and custom local documents.
- CDP PR Invalid: packaged pointer coordinates were mapped from Retina pixels incorrectly #109 now contains a repeatable environment-gated WebScene React acceptance test. It verifies the pre-execution wait barrier, external source map and sourcesContent, original main.jsx breakpoint mapping, pause in increment, paused-frame evaluation, React closure scopes (count = 0 and setCount), step-over, resume, and rendered result 1.
- The acceptance run emits a machine-readable JSON report containing target/source identities, original and generated lines, function name, pause count, closure value, and final rendered result.
- The real run exposed a WebScene host-boundary defect: Runtime.evaluate could schedule a Promise microtask that was never drained under V8's explicit microtask policy. WebScene now performs a microtask checkpoint after each outer Inspector task while keeping nested paused-loop commands isolated from page microtasks.
- Native regressions now cover direct-script and Runtime.evaluate pause/step/resume flows plus Promise microtask draining.
- Release validation passed: all four native CTest targets, Avalonia tests 38/38, Uno desktop build with zero warnings/errors, CDP Inspector tests 38 passed plus the separately enabled real WebScene acceptance.
- The packaged Inspector visibly opened original main.jsx, hit the mapped breakpoint, and displayed count/setCount. Its own remote CDP endpoint successfully resumed the separate paused WebScene V8 session.
Current screenshots and machine-readable reports are retained in the local acceptance artifacts; both draft PR descriptions link the cross-repository implementation and validation. CI is running for WebScene b1e4598 and CDP e09587c.
Implementation status update from draft PR #8:
- Remote Inspector discovery is authenticated for non-loopback bindings and no longer discloses its bearer credential before authorization (
decb56b). - Managed Inspector connect/send/drain/disconnect calls now share an engine-lifetime lease with destruction, including concurrent send/destroy stress coverage (
094b25f). - Inspector-only console, exception, promise-rejection, and async-stack instrumentation is inactive when no session exists (
9a11ce7). - Pull requests that touch the native/Inspector surface now compile and test a V8-enabled osx-arm64 runtime with the pinned patched SDK (
bbd0d39). - Remote command-line launch requires a caller-known 32+ character
WEBSCENE_INSPECT_TOKEN, never a generated secret discoverable only inside the app (2d68f2d).
All four PR review threads are resolved. Standard CI is green on Ubuntu/macOS/Windows; local Release validation is native CTest 4/4, Avalonia net10 43/43, tooling 18/18, and Uno clean. The dedicated V8 PR lane is currently executing its full native test/package/WPT/interop step: https://github.com/wieslawsoltes/WebScene/actions/runs/30843011441
Cross-repository authored TypeScript/JavaScript live edit remains validated through CDP PR #109: original source-map mutation is dry-run and applied with
Debugger.setScriptSource, and the real React WebScene target executes the replacement source.- Remote Inspector discovery is authenticated for non-loopback bindings and no longer discloses its bearer credential before authorization (
Performance acceptance architecture update (
9a1d518): Inspector is now a separate compile-time runtime flavor. Production builds default toWEBSCENE_NATIVE_ENGINE_ENABLE_V8_INSPECTOR=OFF, which removes the Inspector dependency, state, queues, hooks, and worker polling; diagnostic builds opt in with--v8-inspector/-V8Inspectorand advertiseWEBSCENE_ENGINE_BUILD_FEATURE_V8_INSPECTORplusv8Inspector:truepackage metadata.Matched Release package validation on the same pinned V8 SDK passed native CTest 4/4, required WPT 1/1, a 12,800-operation interop race with zero faults/leaks, NuGet creation, and consumer build for both flavors. Production is 31,108,688 bytes with no Inspector implementation markers; diagnostics is 31,888,736 bytes, isolating the 780,048-byte feature cost from ordinary applications.
Remaining literal Chrome DevTools parity after the V8 source-debugging stage
PRs CDP #109 and WebScene #8 define the current stage boundary: authoritative V8 Inspector transport and lifecycle, Chrome discovery/attachment, Runtime/Debugger/Profiler/HeapProfiler, source maps, authored JS/TS/JSX mutation, breakpoints, pause/stepping/scopes/watches, live edit, WebAssembly debugging, and the compact Inspector source/debug workspace.
The following work remains for literal Chrome DevTools browser parity. It should continue under this issue after the current stage merges; it is not silently treated as complete by the V8 source-debugging PRs.
1. WebScene browser and renderer domains
- Implement a WebScene-owned
Target/Pagelifecycle model, frame tree, navigation events, document metadata, reload, screenshot, and screencast semantics where WebScene can support them. - Implement a stable native
DOMnode identity model and CDP projection: document/tree retrieval, child requests, attribute/text mutations, search, node resolution, mutation events, backend node IDs, iframe ownership, and navigation invalidation. - Implement
CSSmatched rules, inline styles, computed styles, stylesheet/source ranges, rule/property mutation, pseudo-state forcing, and source mapping back to authored CSS. - Implement
Overlayinspect mode, hover/selection highlighting, box-model geometry, hit testing, rulers, and layout overlays for flex/grid where supported. - Implement
Networkrequest/response lifecycle events, headers, timing, cache/service state, bodies, failures, initiators, redirects, and WebSocket/resource visibility from the native loader. - Implement
Storage/ Application coverage for local/session storage, cookies or explicitly unsupported cookie behavior, cache data, quotas, and origin clearing. - Implement browser-backed
DOMDebugger, event-listener, DOM mutation, XHR/fetch, instrumentation, and resource breakpoints. - Publish an explicit supported-command matrix; unsupported browser commands must return deterministic protocol errors without damaging the V8 session.
2. Full VS Code-class source editor in the CDP Inspector
- Integrate a real JavaScript/TypeScript language service, including diagnostics, completion, signature help, hover, go-to definition, references, rename, symbols, semantic tokens, formatting, and import/project awareness.
- Add reversible pretty-printing for minified JavaScript with breakpoint, execution-line, search-result, and live-edit location mapping.
- Add a persistent Debug Console with command history, multiline editing, completion, object-tree expansion, copy/export, evaluation context selection, and console/runtime event interleaving.
- Complete editor navigation UX: reusable tabs, preview/pinned tabs, breadcrumbs, history, quick open, command palette, global symbol search, split editors, and keyboard-remappable commands.
- Complete breakpoint UX: inline condition/log/hit-count editing, grouping, enable/remove-all actions, exception filters, unresolved diagnostics, source-map rebinding status, and multi-session ownership.
- Add multi-target/session/thread debugging, including target selection, per-session pause state, simultaneous Node/Chrome/WebScene targets, and safe reconnect/state restoration.
- Complete workspace mutation semantics for JS/TS/framework files: filesystem watchers, disk/runtime conflict UI, undo/redo across regeneration, atomic writes, source-map refresh, and rollback.
- Finish accessibility, focus order, automation metadata, screen-reader naming, high-contrast rendering, keyboard-only operation, and compact/responsive layouts at supported window sizes.
3. Framework-aware debugging
- Add React DevTools bridge support for component trees, props, hooks/state, owner stacks, profiling, highlight/update overlays, and version negotiation.
- Define equivalent extension contracts for Vue/Svelte and framework-specific authored-source regeneration without moving V8 protocol ownership out of V8.
4. Parity verification and release gates
- Maintain a machine-readable domain/command/event parity matrix against the pinned V8 and Chrome protocol versions.
- Run real Release sessions against WebScene, Node, and Chrome in headless and visible modes; validate Chrome DevTools and the packaged CDP Inspector concurrently.
- Add end-to-end fixtures for navigation, iframe replacement, worker/realm handling where supported, async stacks, exceptions/rejections, profiling, heap snapshots, live edit, source-map mutation, and reconnect while paused.
- Capture deterministic screenshots and accessibility trees for compact, standard, and narrow source/debug layouts.
- Keep production WebScene performance matched to main, with the Inspector compiled out by default and repeatable startup/CPU/memory measurements.
- Require clean cross-platform CI, package/consumer smoke, security tests, protocol fuzz/backpressure tests, and no unresolved review threads before each preview release.
Current-stage closeout
- Merge and preview-release CDP Invalid: packaged pointer coordinates were mapped from Retina pixels incorrectly #109 after its final latest-head acceptance pass.
- Complete WebScene Inspector-disabled matched performance evidence and the current native V8 CI lane.
- Obtain Dan's final approval before merging WebScene Add end-to-end WebScene V8 Inspector debugging #8.
- Implement a WebScene-owned
New exact-binary application proof is available in PR #8: the real 7guis-React WebSceneHost runs against the Inspector-enabled V8 binary, opens original source-mapped
main.jsx, resolves and pauses a React breakpoint, exposes call stack/scopes/watch state, supports F10/F5 through the packaged CDP Inspector. See the validation record with screenshots. Remaining Chrome DevTools parity work stays tracked by the detailed backlog above.CDP source-editor and V8 validation stage update
The next CDP editor/debugging slice is now on CDP main in four granular commits:
- wieslawsoltes/CDP@7c41149 — embedded TypeScript 5.9 language service running in-process through Jint, with completion, hover, diagnostics, signature help, definition, references, rename, symbols, semantic classifications, and formatting APIs for JS/JSX/TS/TSX.
- wieslawsoltes/CDP@883b063 — Sources editor wiring for cancellable completion and hover plus debounced diagnostics; paused V8 runtime hover retains priority.
- wieslawsoltes/CDP@1aff518 — NativeAOT-safe source-generated JSON construction for remote CDP requests and accessibility payloads.
- wieslawsoltes/CDP@a581d20 — reproducible validation record with screenshot and recording.
Validation at a581d20:
- complete Inspector headless UI suite: 154/154
- V8 Inspector suite: 39 passed, one environment-gated WebScene case skipped
- language service: 3/3; accessibility: 10/10; protocol: 10/10
- real Chrome: breakpoint, evaluation, resume, CPU profiler, heap profiler, and screenshot
- real Node through CdpService: attach, breakpoint, pause, source/call-frame state, and 30-second heartbeat
- packaged Release Inspector connected to real Node, paused in the actual fixture, loaded 71 scripts, and displayed source, call stack, locals, and watch state
- the Inspector application was simultaneously controlled through its own remote CDP endpoint while debugging Node
- complete Release solution build: zero errors
Evidence:
- validation record
- paused Node V8 screenshot
- debug-session recording
- exact WebScene 7GUIs React validation
The language-service API surface is implemented, while issue #7 deliberately remains open for its remaining UI command wiring, import/project awareness, multi-target editor workflow, browser/renderer domains, and literal Chrome DevTools parity items. The next CDP preview release is pending the exact-head main CI result. WebScene PR #8 remains unmerged pending Dan final approval.
Current-stage closeout
CDP preview.33 is fully published: https://github.com/wieslawsoltes/CDP/releases/tag/v0.1.0-preview.33
Release result:
- exact release commit: wieslawsoltes/CDP@44a6b29
- complete release workflow passed: https://github.com/wieslawsoltes/CDP/actions/runs/30878123419
- 59 GitHub release assets, including Windows MSI/ZIP, Linux tar/DEB, macOS x64/arm64 tar/DMG, Inspector packages, and the new JavaScript language-service package
- NuGet publication reported success for the complete package set, including Chrome.DevTools.Inspector 0.1.0-preview.33 and Chrome.DevTools.JavaScript.LanguageServer 0.1.0-preview.33
- release notes link the validation record, WebScene PR, and this remaining-parity issue
WebScene PR #8 current head is 16a8593:
- corrected V8 exception line/column conversion (aeafd3d)
- bounded aggregate inbound Inspector bytes (66fef97)
- fixed the Windows net8 HttpListener shutdown race exposed by exact-head CI (16a8593)
- Native V8 Inspector, Ubuntu, macOS, and Windows checks all passed
- unresolved review threads: 0
- merge state: CLEAN / MERGEABLE
WebScene remains intentionally unmerged because Dan has not yet replaced the historical changes-requested review with final approval. The remaining literal Chrome DevTools parity backlog above stays open and authoritative.
CDP Sources JS/TS navigation and refactoring stage
CDP main now wires the existing TypeScript semantic engine into the Inspector Sources UI as a project-aware editing workflow.
Implemented:
- bounded project synchronization from Sources workspace and cached V8 scripts: maximum 256 JS/TS documents and 8 MiB aggregate text; binary inputs are skipped
- generated V8 script source caching after Debugger.getScriptSource
- F12 go to definition and Shift+F12 references
- F2 inline rename with identifier validation, multi-file workspace writes, preflight rejection of unsupported secondary runtime-script edits, and best-effort rollback if a remote write fails
- Ctrl+Shift+O document symbols and a hierarchical Explorer Outline
- Shift+Alt+F TypeScript formatting
- signature help on opening parenthesis and comma without reloading the whole remote project
- compact Outline, Refs, and Format actions in the existing source toolbar; the inline rename widget overlays the editor instead of adding another stacked panel
- language actions are shown only for JS/TS-family files
Granular commits:
- wieslawsoltes/CDP@bf5b00d bounded project loading and remote mutation boundary
- wieslawsoltes/CDP@99f3903 Sources navigation/refactoring UI
- wieslawsoltes/CDP@dd3d9d2 deterministic service and headless editor coverage
Release validation:
- CDP.Inspector.Shared Release build: succeeded
- JavaScript language service: 3/3 passed, including true cross-document definition/reference/rename semantics
- focused Sources JS/TS headless tests: 2/2 passed
- complete Inspector shared headless suite: 155/155 passed
- generated screenshots: sources-typescript-completion.png and sources-typescript-navigation-rename.png
This advances the code-editor parity lane but does not close issue #7. Remaining Chrome DevTools parity includes command palette/quick-open, search/replace UX, full semantic token presentation, richer peek/references UI, edits/history/diff UX, advanced breakpoint editor behavior, and broader browser/Node/WebScene acceptance matrices.
Exact-head CI closeout
CDP exact head dd3d9d2 is fully green after rerunning one unrelated Windows inactivity-abort flake:
- Ubuntu, macOS, and Windows complete test matrices passed
- WinUI 3, Uno, WPF, Avalonia, and Avalonia 11 NativeAOT integration passed
- Linux, macOS, and Windows build/package jobs passed
- final NuGet aggregation passed
Workflow: https://github.com/wieslawsoltes/CDP/actions/runs/30880683936
The first Windows attempt had no assertion failure: 670 RDP tests passed before the test host exceeded the existing 60-second inactivity guard during unrelated RdpFrameBufferTests teardown. The failed-job rerun passed without source changes. This JS/TS Sources stage is complete; issue #7 remains open for the documented remaining parity backlog.
CDP Sources navigation parity stage — exact-head closeout
CDP main now includes the next compact VS Code-style source navigation slice in two granular commits:
- wieslawsoltes/CDP@0cfc208 — compact editor overlay with Quick Open, Command Palette, current-document symbols, and project-wide symbols.
- wieslawsoltes/CDP@948ba6b — deterministic routed-keyboard/headless coverage and screenshot evidence.
Implemented behavior:
Ctrl+P: fuzzy file/path search across workspace files and loaded V8 runtime scripts.Ctrl+Shift+P: one command surface for editor navigation/refactoring plus debugger actions such as breakpoint, continue, pause, stepping, and run-to-cursor.Ctrl+Shift+O: current JS/JSX/TS/TSX symbol search backed by the embedded TypeScript service.Ctrl+T: bounded project-wide JS/JSX/TS/TSX symbol search across the loaded language-service project.- Up/Down selection, Enter execution, Escape close, double-click execution, editor focus restoration, result counts, fuzzy filtering, stable async request invalidation, and preservation of a query typed while symbols load.
- The UI is a centered overlay inside the existing source editor split. It adds no stacked sidebar/debugger panels and retains the existing Explorer/Outline/editor/debugger split layout.
Validation at exact CDP head
948ba6b:- focused TypeScript Sources suite: 3/3 passed, including actual Avalonia routed keyboard gestures, file filtering, command filtering, document symbol navigation, and project symbol discovery.
- complete Inspector shared headless suite: 156/156 passed.
- complete Release solution build: 0 errors.
- exact-head .NET CI: all Ubuntu/macOS/Windows test matrices, all five NativeAOT lanes, all three platform build-and-pack jobs, and final NuGet aggregation passed: https://github.com/wieslawsoltes/CDP/actions/runs/30884388016
- docs build passed: https://github.com/wieslawsoltes/CDP/actions/runs/30884387822
- screenshot captured as
artifacts/headless-screenshots/sources-command-palette.pngand posted in the development thread for visual review.
Review and cross-repository state:
- CDP PR Invalid: packaged pointer coordinates were mapped from Retina pixels incorrectly #109 is merged and has 0 unresolved review threads.
- WebScene PR Add end-to-end WebScene V8 Inspector debugging #8 remains mergeable at
16a8593, all required checks are green, and it has 0 unresolved review threads. - WebScene PR Add end-to-end WebScene V8 Inspector debugging #8 remains intentionally unmerged until Dan replaces the historical changes-requested review with final approval.
- No newer Inspector-enabled V8 binary arrived during this UI-only stage. The next binary will be rerun against 7guis-React WebSceneHost with fresh screenshots; the current exact-binary proof remains at https://github.com/wieslawsoltes/WebScene/blob/agent/v8-inspector/docs/validation/7guis-react-v8-inspector.md
Issue #7 remains open. The next editor/debugger parity work still includes reusable preview/pinned tabs and history, search/replace and richer references/peek UX, semantic token presentation, advanced breakpoint editing/state, filesystem/runtime conflict and diff workflows, multi-target sessions, and the WebScene browser/renderer domain backlog.
V8 debugging milestone complete
The cross-repository V8 debugging goal is complete at the agreed working-debugger boundary. Literal Chrome DevTools and VS Code parity remains follow-up work in this issue and is no longer a blocker for closing the implementation goal.
Completed CDP stage
- CDP PR Invalid: packaged pointer coordinates were mapped from Retina pixels incorrectly #109 is merged and CDP v0.1.0-preview.33 is published.
- The Inspector supports discovery and attachment to Node, Chrome, and WebScene V8 targets; Runtime and Debugger sessions; pause, resume, stepping, breakpoints, call stacks, scopes, watches, evaluation, source maps, authored JS/TS/JSX mutation, live edit, profiling, heap tooling, WebAssembly debugging, and the compact Sources/debug workspace.
- Post-release editor/navigation work is on CDP main at exact head 948ba6b, including the TypeScript language service, definition/references/rename/format/symbol workflows, Quick Open, Command Palette, and project/document symbols.
- Exact-head CI is green across Ubuntu, macOS, Windows, all NativeAOT lanes, platform packaging, NuGet aggregation, and docs: https://github.com/wieslawsoltes/CDP/actions/runs/30884388016
Completed WebScene implementation stage
- WebScene PR Add end-to-end WebScene V8 Inspector debugging #8 is implementation-complete at exact head 16a8593.
- Native V8 Inspector lifecycle, context/session ownership, paused-loop control, secure discovery/WebSocket hosting, backpressure limits, source maps, live edit, exception handling, multi-session behavior, compile-time production/diagnostic flavors, and shutdown/race hardening are implemented and covered.
- Native V8 Inspector, Ubuntu, macOS, and Windows checks all pass.
- The PR is CLEAN / MERGEABLE and has zero unresolved review threads.
- Dan is already requested for review. The PR remains intentionally unmerged until Dan replaces the historical changes-requested review with final approval.
End-to-end acceptance evidence
- Real Chrome and Node validation: https://github.com/wieslawsoltes/CDP/blob/main/docs/articles/v8-inspector-language-service-validation.md
- Exact WebScene 7GUIs React validation with original source-mapped main.jsx debugging, breakpoint pause, call stack/scopes/watch, stepping/resume and screenshots: https://github.com/wieslawsoltes/WebScene/blob/agent/v8-inspector/docs/validation/7guis-react-v8-inspector.md
- When a new Inspector-enabled V8 binary is published, rerun this same 7guis-React WebSceneHost acceptance and attach fresh screenshots here.
Deferred work
This issue remains open as the authoritative backlog for the already documented remaining browser/renderer domains, full editor and advanced breakpoint UX, multi-target debugging, framework tooling, mutation conflict/history workflows, accessibility/layout polish, parity matrices, and expanded release gates. Those items are future parity stages, not defects preventing current V8 debugging from working.
Disposition after live verification:
- PR Add end-to-end WebScene V8 Inspector debugging #8 merged as
7f8f43b51890ba3c77bae2bf98e28d565dd2922eon 4 August 2026. - The latest milestone report states that the agreed working-debugger goal is complete and no longer blocks current Code OSS release acceptance.
- Concrete deferred browser/renderer domains, advanced editor and breakpoint UX, multi-target/framework tooling, mutation history, accessibility/layout polish, and parity matrices now live in backlog issue Complete deferred V8 Inspector browser, editor, and framework parity #397.
Removing
vscode-oss/planned, detaching this completed implementation milestone from #227, and closing it as completed. #397 is intentionally outside the current release graph.- PR Add end-to-end WebScene V8 Inspector debugging #8 merged as


Summary
Add first-class V8 Inspector and Chrome DevTools Protocol (CDP) support to WebScene so JavaScript and React code running inside the native V8 engine can be discovered and debugged from Chrome DevTools and compatible IDEs.
Today, WebScene can execute JavaScript, capture V8 stack traces, queue
console.log/warn/erroroutput, report unhandled promise rejections, and evaluate code from the managed host. It cannot currently be attached to as a JavaScript debugging target because it does not create av8_inspector::V8Inspector, expose an Inspector protocol session, host a CDP WebSocket, or publish a discoverable target.This issue covers the complete path from the embedded V8 isolate to a working
chrome://inspectsession, including source-mapped breakpoints in original JSX.Current behavior
WebScene currently provides diagnostic information but not an interactive debugger:
v8::ScriptOrigindocument/resource name;console.log,console.warn, andconsole.errorare captured in a bounded native queue, includingError.stackwhen present;LastErrorandDrainConsoleMessages();This is enough for logs and post-failure diagnosis, but not for IDE-grade source debugging. In particular, there is currently no support for:
Runtime.enableorDebugger.enablebacked by the actual WebScene V8 isolate;evaluateOnCallFrame;Using the existing
Chrome.DevTools.Protocolserver by itself does not solve this. Its Avalonia/UnoRuntimeandDebuggerdomains inspect or simulate the managed application and do not control WebScene's embedded V8 isolate.Goal
Support the following development workflow:
Launch a WebScene application with an explicit inspector option, for example:
Open
chrome://inspect/#devicesin Chrome.Configure
localhost:9229as a network target.See the WebScene document as a discoverable target.
Click Inspect to open Chrome DevTools.
See loaded WebScene JavaScript in Sources.
Set a breakpoint in original JSX using a source map.
Interact with the native Avalonia or Uno application.
Pause inside the real V8 execution context.
Inspect call frames, scopes, local variables, and expressions.
Step and resume without blocking the UI or corrupting the WebScene worker lifecycle.
An optional break-on-start mode should also be supported:
Recommended ownership and repository split
The V8 debugger implementation must be owned by WebScene because WebScene owns the V8 isolate, V8 contexts, navigation lifecycle, and native engine worker.
The existing
wieslawsoltes/CDPrepository can provide reusable HTTP discovery and WebSocket transport, but it must forward Inspector JSON unchanged. It should not reimplement V8Runtime,Debugger,Profiler, orHeapProfilersemantics in managed code.Recommended responsibility split:
V8Inspector, Inspector client, sessions, and context groups/jsondiscovery and WebSocket transportIf the CDP repository is not used initially, WebScene may provide a minimal loopback-only discovery/WebSocket server for the first vertical slice. The long-term design should avoid maintaining two independent CDP transports.
Proposed architecture
The native V8 Inspector must remain the source of truth for command responses, notifications, remote-object identifiers, script identifiers, breakpoints, call frames, profiler data, and debugger state.
Required implementation
1. Enable and link V8 Inspector
v8-inspector.hin the native engine target.2. Add the native Inspector client
Implement a
v8_inspector::V8InspectorClientowned by the V8 isolate.It must support at least:
runMessageLoopOnPause(int contextGroupId);quitMessageLoopOnPause();runIfWaitingForDebugger(int contextGroupId);Create the
v8_inspector::V8Inspectoronly after the isolate is valid and destroy it before disposing the isolate.3. Register V8 contexts correctly
contextCreated()for the root context after its embedder data and globals are installed.contextDestroyed()before resetting each V8 context.resetContextGroup()when navigation replaces a document.WebScene optionally supports shared isolates. Since
V8Inspectoris isolate-owned while sessions attach to context groups, shared-isolate mode needs explicit handling:The MVP must not silently expose the wrong WebScene document when multiple runtimes share an isolate.
4. Add one Inspector session per debugger connection
Each connected DevTools/IDE client should receive its own
V8InspectorSessionand channel.The channel must forward:
sendResponse(callId, message);sendNotification(message);flushProtocolNotifications().Messages must be preserved byte-for-byte as UTF-8 JSON wherever possible. Do not parse and reconstruct V8 protocol payloads in managed code.
Session teardown must call
stop()/release the session safely, remove pending messages, and release debugger state without tearing down the WebScene document.5. Integrate with the engine worker
All calls into
V8InspectorSession::dispatchProtocolMessage()must occur with the correct isolate/context/thread ownership.webscene_engine.6. Implement the paused nested loop
When V8 invokes
runMessageLoopOnPause(), the WebScene engine worker must enter a nested loop that:Debugger.resume, stepping commands, paused evaluation, property inspection, and object release;quitMessageLoopOnPause()is called;This loop is essential: accepting a WebSocket without implementing pause-loop behavior would allow some
Runtimecommands but would hang on real breakpoints.7. Add a native Inspector ABI
Add an ABI surface similar to:
Exact naming and ABI versioning may differ, but the contract must remain asynchronous and worker-safe. Avoid calling managed code with the complete protocol message directly from a paused V8 stack.
Update:
8. Add managed Inspector wrappers
Expose a managed session abstraction in the native backend, for example:
The managed wrapper must:
Also bring the Uno diagnostics surface to parity by exposing public console and last-error access, even though Inspector will become the preferred interactive diagnostics path.
9. Add raw CDP transport support
Chrome expects the standard discovery endpoints:
/json/listshould return at least:[ { "description": "WebScene V8 document", "id": "<stable-target-id>", "title": "<document title>", "type": "page", "url": "<document URL>", "devtoolsFrontendUrl": "devtools://devtools/bundled/inspector.html?ws=127.0.0.1:9229/devtools/page/<target-id>", "webSocketDebuggerUrl": "ws://127.0.0.1:9229/devtools/page/<target-id>" } ]The
wieslawsoltes/CDPrepository already has discovery and WebSocket server code, but its current concrete session parses commands and dispatches them into managed domain handlers. Add a raw/pass-through session contract, such as anICdpConnectionSessionorIRawCdpTargetSession, so a WebScene target can:CdpDispatcherfor V8-owned domains;Do not register replacement managed handlers for V8
Runtime,Debugger,Console,Profiler, orHeapProfilerdomains.The current
Chrome.DevTools.Protocolpackage includes unrelated dependencies such as Jint, SkiaSharp, profiling libraries, and XAML tooling. Prefer extracting a lightweight transport/discovery package rather than adding that full dependency graph to WebScene runtime packages.10. Forward console and exception information to Inspector
WebScene currently implements a custom JavaScript
console. Continue supporting the existing host console queue, but also send Inspector-compatible console messages so the DevTools Console panel receives them.Error.stackfor logged error objects.11. Preserve useful script identities
WebScene already supplies a
v8::ScriptOriginusing the resource/document name. Preserve and strengthen this behavior:sourceURLandsourceMappingURLdirectives;Debugger.scriptParsedcontains stable URLs suitable forsetBreakpointByUrl.12. Enable source-mapped original-source debugging
V8 Inspector can debug generated JavaScript without source maps, but original React/JSX debugging requires the consuming build to emit them.
Update the 7GUIs validation sample from:
sourcemap: falseto an appropriate development configuration such as:
Prefer an inline source map for the first vertical slice to avoid unrelated map-fetching and file-URL issues. Follow with external source-map coverage using stable URLs.
The production build may continue disabling source maps unless explicitly configured otherwise.
Verify that DevTools displays
src/main.jsxand that a breakpoint in JSX binds to the correct generated location indist/main.js.13. Add opt-in launch configuration
Provide a documented configuration API and command-line integration for hosts, for example:
Equivalent managed options should support applications that do not use command-line parsing.
Required behavior:
0support for automatic ephemeral-port selection where practical;inspect-brkwaits before application scripts execute, but keeps the host responsive enough for discovery and connection;14. Security requirements
A CDP connection permits arbitrary JavaScript execution and inspection of application state. Treat the endpoint as privileged.
Originvalues or document the chosen local-development origin policy.Expected initial DevTools functionality
The first complete implementation should enable:
chrome://inspect;Runtime.evaluate;V8 Inspector alone does not supply WebScene's browser/renderer domains. The following are follow-up work rather than blockers for JavaScript source debugging:
Chrome DevTools may show unsupported tabs or issue unsupported browser-domain commands. Those commands should fail cleanly without breaking the V8 debugging session.
Suggested implementation phases
Phase 1: Native protocol proof
Runtime.enable,Debugger.enable, andRuntime.evaluatein a native test.Debugger.scriptParsednotifications through an in-memory channel.Phase 2: Breakpoint and pause-loop proof
Debugger.paused, evaluate on a call frame, step, and resume.Phase 3: Native ABI and managed bridge
Phase 4: Chrome transport
/json/list.chrome://inspect.Phase 5: Source maps and 7GUIs validation
src/main.jsxrather than onlydist/main.js.Phase 6: hardening and documentation
Testing requirements
Native unit/integration tests
Runtime.enableandDebugger.enableresponses.Debugger.scriptParsedincludes the expected script URL.Runtime.evaluatereturns primitive and object results.Debugger.setBreakpointByUrlresolves a breakpoint.Debugger.pausedwith real V8 call frames.Debugger.resumework.ABI and managed tests
CDP transport tests
/json/versionreturns actual protocol/runtime metadata./json/listreturns a valid WebScene target and WebSocket URL.End-to-end acceptance test
Use the React 7GUIs WebScene host as the validation application:
/json/list.RuntimeandDebugger.Debugger.scriptParsedfor the bundle and its source map.src/main.jsxCounter event handler.Debugger.pausedat the original source location.Acceptance criteria
chrome://inspect.Runtime.enableandDebugger.enableare served by the actual WebScene V8 isolate.References
wieslawsoltes/CDP