



Finalytics is a portfolio analytics engine written in Rust, with bindings for Python and JavaScript. It compares portfolio optimisation methods on returns they have not seen, and keeps the books of a real portfolio to report its performance, risk and attribution.
| Language | Package | Install |
|---|---|---|
| Rust | finalytics |
cargo add finalytics |
| Python 3.10+ | finalytics |
pip install finalytics |
| JavaScript and TypeScript | finalytics |
npm install finalytics |
Until 1.0.0 is released, these commands install the 0.x series. Install a 1.0
pre-release with cargo add finalytics@<version>, pip install --pre finalytics
or npm install finalytics@next. The
migration guide explains what replaces each part
of 0.9.
Sample reports, built by the programs below from the bundled datasets: comparison · backtest · optimisation · portfolio · rebalance
Compare optimisation methods on the same assets. Each method is refitted every quarter on the five years before, and judged on the quarter that follows.
//! Six optimisation methods compared walk-forward on 30 years of six asset
//! classes.

use finalytics::prelude::*;

fn main() -> Result<()> {
    let assets = Assets::builder()
        .prices(datasets::asset_class_prices())
        .risk_free_asset("T-Bills")
        .build()?;

    let result = assets
        .compare([
            Method::EqualWeight,
            Method::MinimumVariance,
            Method::MaximumSharpe,
            Method::MaximumDiversification,
            Method::RiskParity,
            Method::HierarchicalRiskParity,
        ])
        .max_weight(0.40)
        .rebalance(Rebalance::Quarterly)
        .walk_forward(Years(5))
        .trading_cost_bps(10.0)
        .build()?;

    result.show()?;
    Ok(())
}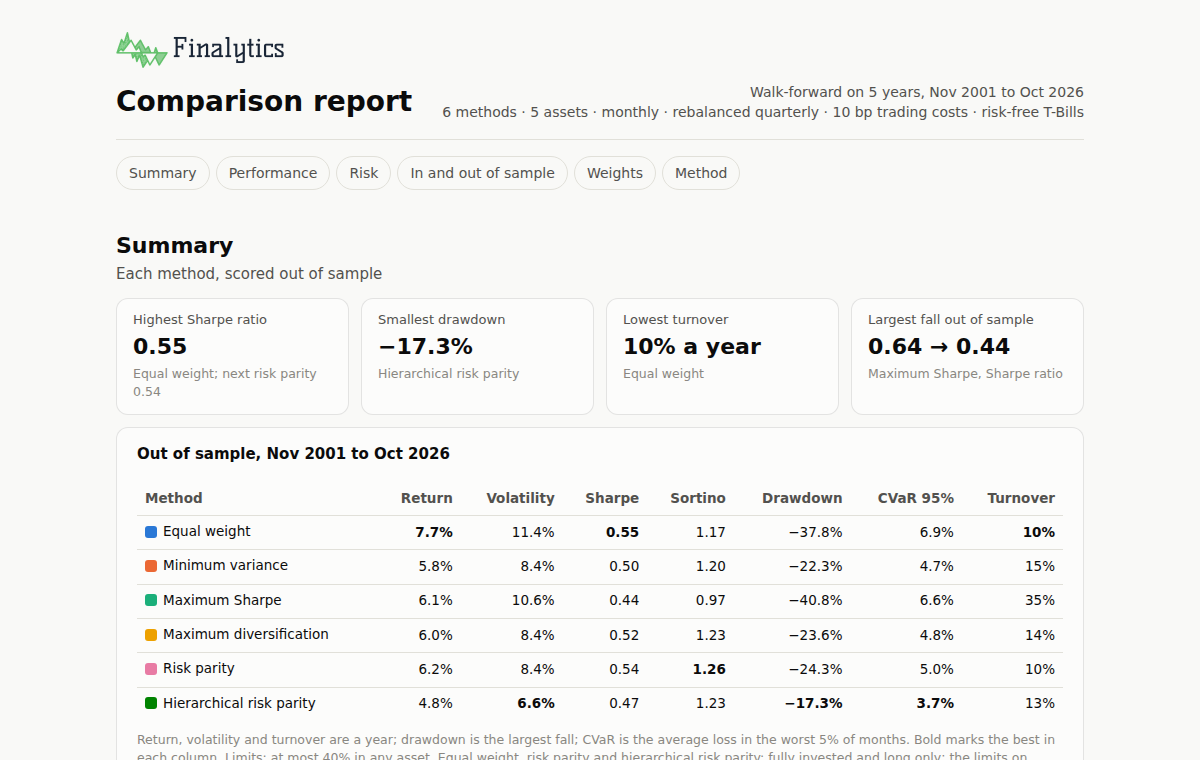
Every result has the same shape: result.report is the report, which
println!("{result}") prints as text and result.show() opens as a page, and
result.results holds every return and trade behind it.
To test one allocation, give a method or your own weights. Here, the maximum Sharpe ratio fitted to the years before November 2016, held from then on against a 60/40 benchmark:
let result = assets
    .backtest(Method::MaximumSharpe)
    .max_weight(0.40)
    .benchmark([("US Equity", 0.60), ("Bonds", 0.40)])
    .rebalance(Rebalance::Quarterly)
    .holdout_from("2016-11-01")
    .build()?;

result.show()?;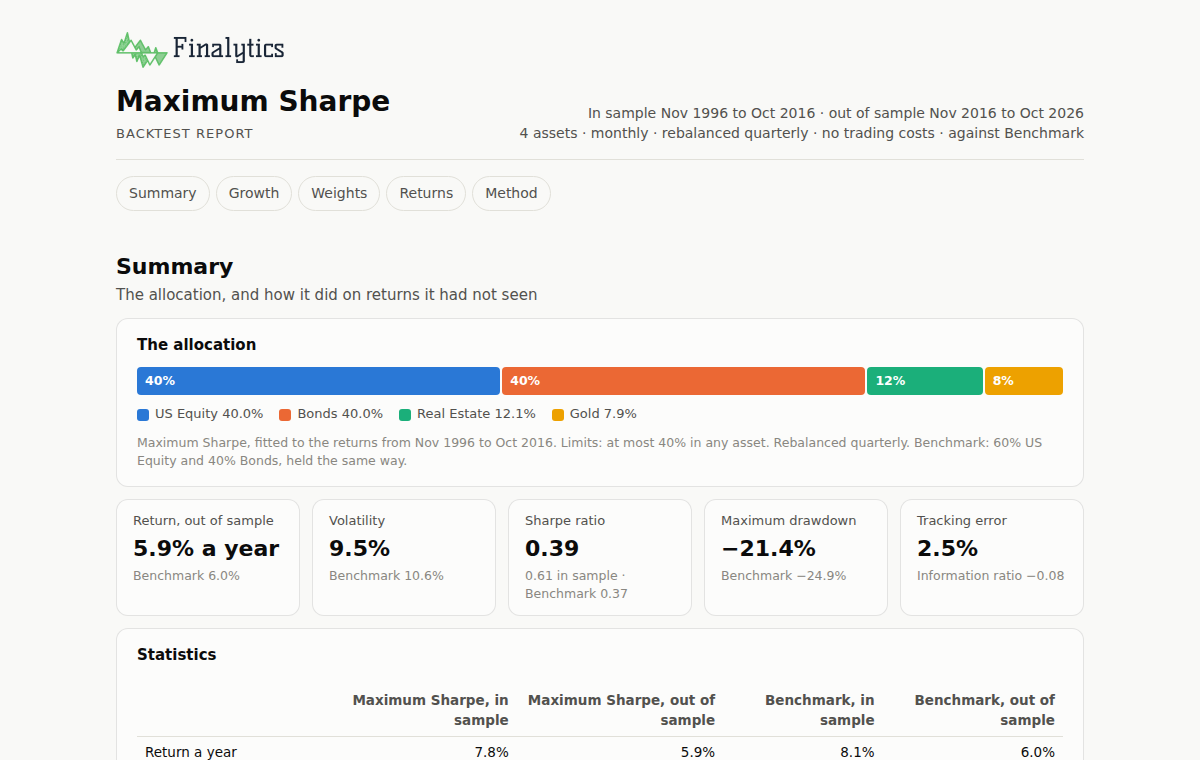
To see the weights a method chooses today, where their risk comes from and where they sit on the efficient frontier:
let result = assets
    .optimise(Method::MaximumSharpe)
    .max_weight(0.40)
    .with_frontier()
    .build()?;

result.show()?;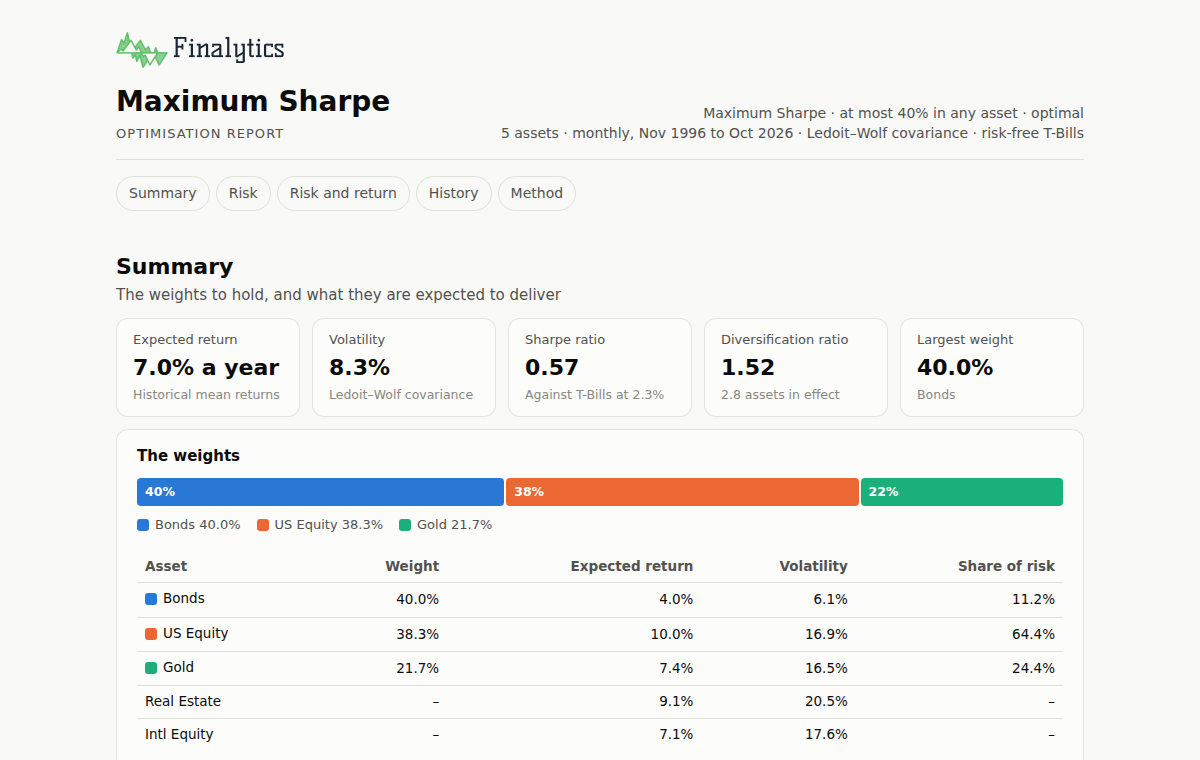
Load a portfolio from its transactions and prices, and report on it: holdings, performance, risk, attribution and scenarios.
//! A portfolio from its CSV files, reported on against its benchmark. Run it
//! in a folder that holds the files.

use finalytics::prelude::*;

fn main() -> Result<()> {
    let portfolio = Portfolio::builder()
        .transactions("transactions.csv")
        .prices("prices.csv")
        .fx("fx.csv")
        .instruments("instruments.csv")
        .accounts("accounts.csv")
        .build()?;

    let report = portfolio
        .report()
        .benchmark("BENCH")
        .group_by(["asset_class", "region"])
        .build()?;

    report.show()?;
    Ok(())
}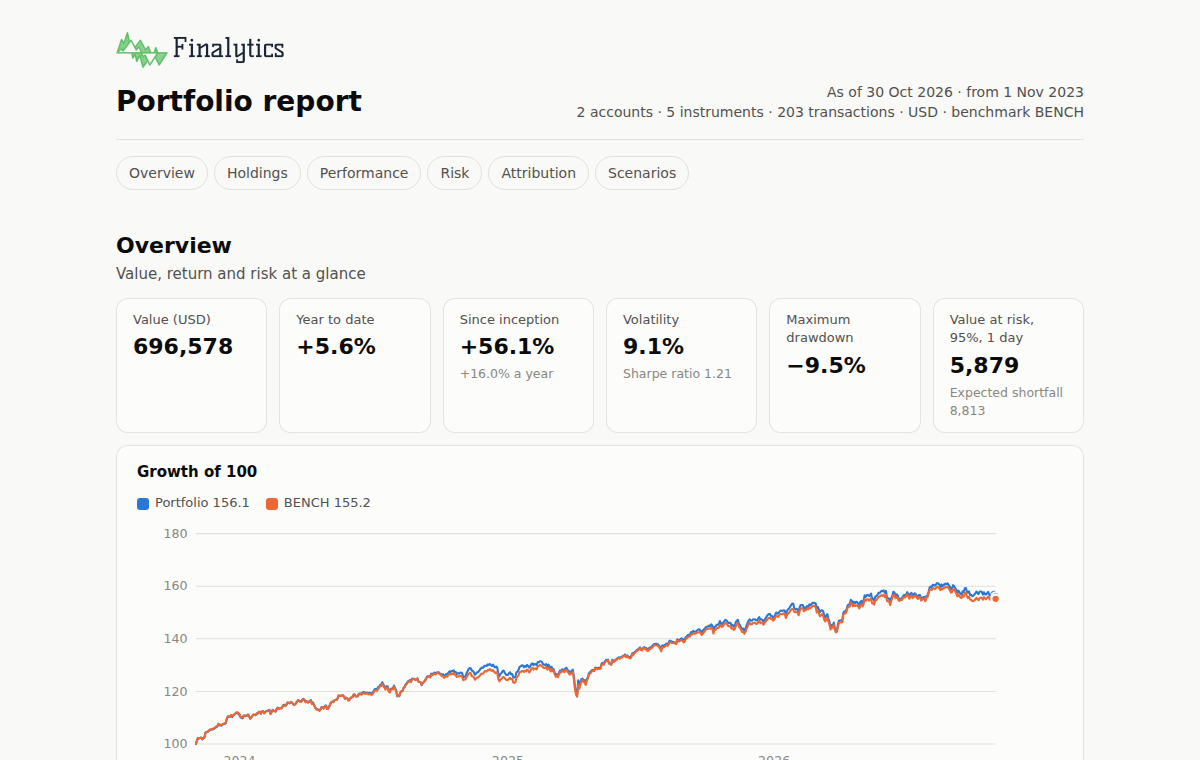
The files are the portfolio dataset: a household's brokerage and retirement
accounts, holding five funds in dollars and euros for three years.
finalytics::datasets::file("portfolio/prices.csv") and the like return each
of them, and datasets::portfolio() loads the same portfolio without them.
BENCH is a column of prices.csv, the benchmark's levels; asset_class and
region are columns of instruments.csv that classify each holding. The sample
report adds the attribution and scenarios of datasets::report_options().
The start of the dataset's files
id,kind,currency,name,class.asset_class,class.region
VTI,fund,USD,Vanguard Total Stock Market ETF,Equity,North America
EXSA,fund,EUR,iShares STOXX Europe 600 UCITS ETF (DE),Equity,Europedate,VTI,EXSA,BND,GLD,VNQ,BENCH
2023-11-01,208.86,43.21,68.99,183.51,73.37,100.0000
2023-11-02,213.01,43.92,69.39,184.12,75.78,101.4345id,name,lot_method,taxable,class.owner,class.wrapper
brokerage,Brokerage account,fifo,true,Alex,Taxable
ira,Retirement account,fifo,false,Alex,Tax-deferredThe data guide describes every file, column by column.
To move the same funds to their least risky mix, 5% to 40% each, optimise the holdings and rebalance the accounts together, with fees and tax rates:
let target = portfolio
    .assets()?
    .optimise(Method::MinimumVariance)
    .bounds(0.05, 0.40)
    .build()?;

let result = portfolio
    .rebalance(&target)
    .whole_units()
    .fee_bps(5.0)
    .minimum_fee(1.0)
    .tax(0.37, 0.20)
    .build()?;

result.show()?;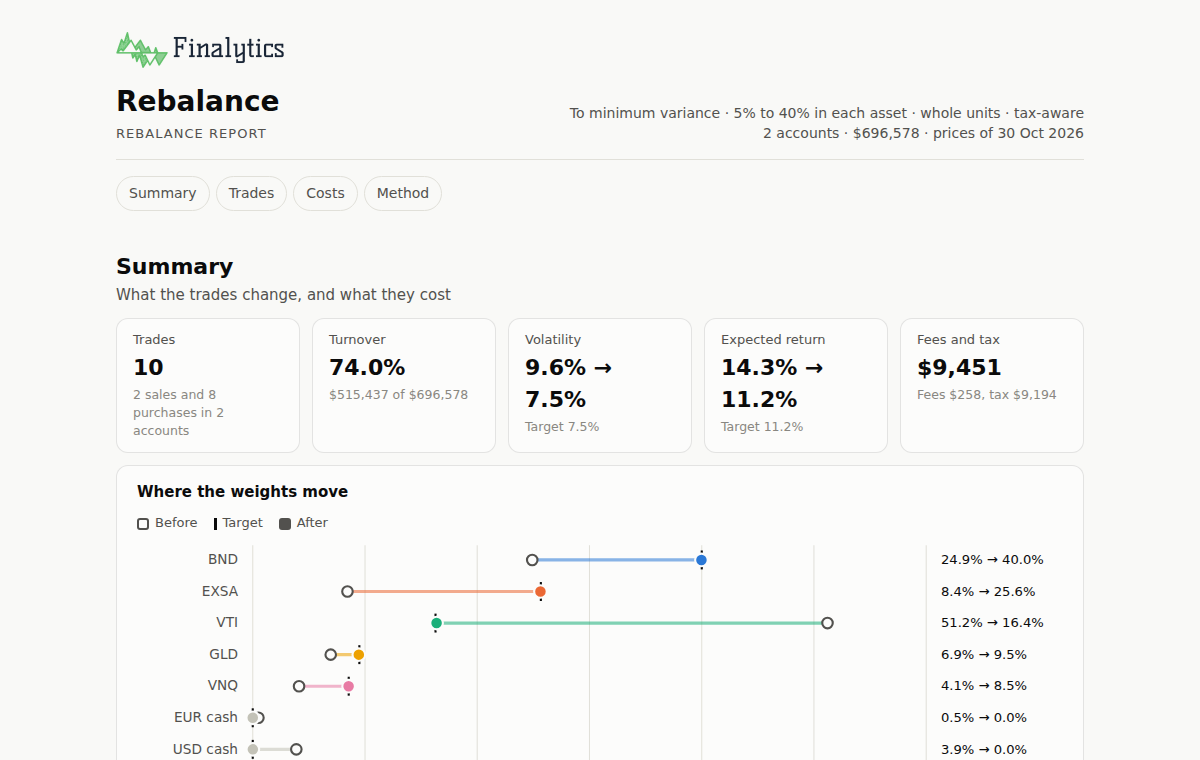

Sales in the brokerage account take the lots that cost the least tax; the
retirement account is not taxable (taxable is false in accounts.csv), so its
sales pay none. portfolio.with_rebalance(&result) makes the trades.
Optimisation
- Equal weight, minimum variance, mean–variance and robust mean–variance, maximum Sharpe, target return or volatility, maximum diversification, minimum CVaR, risk parity, hierarchical risk parity
- Limits on each asset and on groups, turnover, tracking error and factor exposure
- Black–Litterman and resampled estimates; Ledoit–Wolf, OAS and EWMA covariance
- Validation in sample, on a holdout, or walk-forward; calendar or drift rebalancing; trading costs
Analytics
- Books from transactions: lots, corporate actions, several accounts and currencies
- Time- and money-weighted returns, contribution, Brinson–Fachler and currency attribution
- Volatility, drawdowns, value at risk, risk decomposition, factor models and scenarios
- Rebalancing trades with fees and tax-aware lot selection, across accounts
Every report prints as text, 80 columns wide, and shows as one self-contained HTML page, in light and dark. Every model is tested against an independent implementation; the methods pages define each one.
API reference · Python package · JavaScript package · Data guide · Methods · Performance · Architecture · Migrating from 0.9
The programs in this README are the crate's examples, and the tests run them.
Contributions are welcome. Please read CONTRIBUTING.md and the Code of Conduct first. To report a security issue, see SECURITY.md.
Licensed under either of the Apache License, Version 2.0 or the MIT licence, at your option. Unless you explicitly state otherwise, any contribution intentionally submitted for inclusion in this project, as defined in the Apache-2.0 licence, shall be dual licensed as above, without any additional terms or conditions.
Finalytics provides analysis tools only. It is not investment advice.